Dallas Fed Fisher’s Prescience And GLD
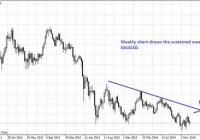
Recent third quarter GDP growth of 5% at 11 years high brings credibility to Fisher’s bullish dissent which is unforeseen by the FOMC. This brings greater possibility of an earlier rate hike forward to the March or April 2015 meeting especially if it is reflected in the upcoming labor figure. GLD paused its decline in this quiet festive market. This is the time to go short GLD before the market resumes fully in the second week of 2015. Voting against the action were Richard W. Fisher, who believed that, while the Committee should be patient in beginning to normalize monetary policy, improvement in the U.S. economic performance since October has moved forward, further than the majority of the Committee envisions, the date when it will likely be appropriate to increase the federal funds rate.” The quote is extracted from the statement of the Federal Open Market Committee (FOMC) released on 17 December 2014 . Dallas Federal Reserve President Richard Fisher took on a more bullish stance than the rest of the committee. During the meeting, the FOMC took reference from the October 2014 economic data and came to a bullish stance where you can read on my previous article ‘ Dissents At The December 2014 FOMC Meeting Hints At Earlier Rate Hikes ‘. At that point, I was not very convinced about Fisher’s outlook as I believe were the case of the rest of the FOMC. The US were showing some strong number such as the November 2014 non farm payroll of 321,000 which is better than the previous reading of 243,000 and expectations of 231,000 and average hourly earnings increase of 0.4% over 0.1% in October and 0.2% of market expectations. However there were misses as well such as the 0.3% contraction of the consumer price index in November after no change in October. Flash manufacturing purchasing manager index came in lower at 53.7 in November compared to a 54.8 reading in October and market expectations of 56.1. However with the 23 December 2014 revision of the third quarter 2014 from 3.9% to 5.0% which is not seen in 11 years since the third quarter of 2003, I am beginning to think that Fisher might be prescient in his observation. The FOMC will meet again next month from 27 to 28 January 2015. They will observe that GDP grew by 5.0% in the third quarter of 2014, at a 11 year high and agree with Fisher’s observation. During Chair Janet Yellen’s latest press conference , she had the following projection about GDP growth: The central tendency of the projections for real GDP growth is 2.3 to 2.4 percent for 2014, up a bit from the September projections.” The fact that GDP grew at such a rapid rate should persuade the Fed to raise rates at an earlier date perhaps in the March or April meetings instead of the June meeting as widely expected in the market. This would be so especially if there is continued improvement in the labor market. Hence we should keep a lookout for 09 January 2015 figures for the non-farm payroll and unemployment rate data. During the same press conference, Yellen set an unemployment target of 5.2% to 5.3% in the quote below: The central tendency of the unemployment rate projections is slightly lower than in the September projections and now stands at 5.2 to 5.3 percent at the end of next year, in line with its estimated longer-run normal level.” However I don’t think that the FOMC would start rising rates when unemployment rate is at 5.2% -5.3%. Instead I am of the opinion that they would start to rise rates as unemployment start to move towards their target as GDP grows. This would obviously be bullish on the United States Dollars (USD) after the market returns from the holiday season on the second week of 2015. Then I turned my thoughts to gold. You might have heard of this argument in one form or another before but it is worth repeating. As the US rises interest rates, it will be more expensive to hold onto gold as it gives no return and in fact cost you in terms of insurance and storage if you were to hold physical gold. Of course, there is the theory that holding gold is an insurance against the economic collapse but this is getting less and less traction especially with GDP growth of 5%. Then there is the argument that gold is a hedge against inflation but inflation is low and even the Fed foresees 1.0% to 1.6% inflation for 2015 if you refer to Yellen’s press conference. However, today I am going to offer a slight twist to it. The USD has not responded much to the record 11 year high GDP reading. You can read about it in my article ‘ USD Asleep As Q3 2014 GDP Hits 11 Years High ‘. In normal trading day, we would have seen USD raise by at least 100 pips but today if you are reading it before the market returns from the holiday, you might be in a position to short gold at a good price as gold gains partial strength by default after sustained selling in the past week with a lesser possibility of being hit by a retracement. Even if you miss the chance to sell gold by the time you read it, you can also sell it but with a wider stop loss. You can take the daily volatility as a guide. (click to enlarge) (click to enlarge) The 2 charts above shows the weekly and daily chart of XAU/USD. XAU is the symbol for gold while USD represents United States Dollar which we are all familiar with. The weekly chart shows that this pair is under constant pressure even if there are periodic upticks. The current weekly chart looks like it is on the downtrend after completing its recent bounce to a high of $1238 two weeks back. The daily chart shows us that the XAU/USD is having one of its uptick but this is likely to be temporary. This is a function of the thin trading market during the festive season and traders can take this opportunity to sell and set their stop loss at $1230. Of course, there is no sure thing in trading and one should set the position size accordingly. For those who want to avoid the leverage inherent in forex, they should use the SPDR Gold Trust ETF (NYSEARCA: GLD ) instead. GLD is listed on the New York Stock Exchange and highly liquid with $26.90 billion of market capitalization and transaction volume of 1.5 million shares. (click to enlarge) The chart above shows the weakness of the GLD after the peak 2 weeks back which is an interim retracement. Now is the time to go short the GLD as it pauses before its downtrend and catch the trend before it slowly resumes again next week.

