The 5 Funds – Q4 2014 Portfolio Review
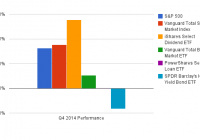
Summary Reviews the performance of The 5 Funds Portfolios. The Vanguard REIT Index was the top performing ETF in the portfolios last quarter. Junk Bonds and International ETFs were the worst performers. Each quarter I plan to update my 3 portfolios: The Aggressive 5, The Moderate 5, and The Conservative 5 and show the performance from the previous quarter, as well as since inception. I’ll also give an update on why I’m making some of the changes and my quick market update. Hopefully this will be helpful for people either following my portfolios or creating their own ETF portfolio. The Conservative 5 Name Symbol Type Allocation Change Vanguard Total Stock Market Index ETF (NYSEARCA: VTI ) Large Cap Blend 25% +5% 1 iShares Select Dividend ETF (NYSEARCA: DVY ) Mid-Cap Value 16% +1% 3 Vanguard Total Bond Market ETF (NYSEARCA: BND ) Intermediate Term Bond Fund 35% None PowerShares Senior Loan ETF (NYSEARCA: BKLN ) Short Term Bond Fund 0% -10% 2 SPDR Barclay’s High Yield Bond ETF (NYSEARCA: JNK ) High Yield Bond Fund 9% -1% 3 iShares Floating Rate Bond (NYSEARCA: FLOT ) Short Term Bond Fund 10% +10% 1 Cash Cash 5% -5% 2 Updated 1/4/2015 Add Allocation Reduce Allocation Investment Drift (No New Trades Required) Conservative 5 Performance* Conservative 5 SPY (S&P 500) Last Month -0.6% -0.3% QTD 2.0% 4.9% YTD – – Since Inception (10/1/2014) 2.0% 4.9% Std Dev. compared to SPY .31 1.0 As of 12/31/2014 Performance by ETF January 2015 Update The biggest update to the Conservative 5 Portfolio is the removal of PowerShares Senior Loan ETF and replacing it with the iShares Floating Rate Bond. The reason for the change is that I’m concerned with the amount of volatility in BKLN. As we saw, it took a few large dips in the 4th quarter of 2014. BKLN consists of a lot of lower quality bonds which is the reason for the volatility, FLOT is a more conservative, less volatile ETF which allows us to increase our position in VTI without adding much additional volatility to the portfolio. We continue to favor equities over bonds in 2015 and feel as rates rise and bonds are hurt, the equity market should outperform. We have also reduced the cash position in the account to 5% and moved that money over to Vanguard Total Stock Market Index. This move will add slightly more risk to the portfolio, but the overall risk of the portfolio should not be increasing significantly. The Moderate 5 Name Symbol Type Allocation Change Vanguard Total Stock Market Index ETF VTI Large Cap Blend 60% +5% 1 Vanguard FTSE Developed Markets ETF (NYSEARCA: VEA ) Large Cap International 5% -5% 2 Vanguard FTSE Emerging Markets ETF (NYSEARCA: VWO ) Emerging Markets 0% -5% 2 Vanguard Total Bond Market ETF BND Intermediate Bond 20% None Vanguard REIT ETF (NYSEARCA: VNQ ) REIT 5% None PowerShares QQQ ETF (NASDAQ: QQQ ) Large Cap Growth 5% +5% 1 Cash Cash 5% None Updated 1/4/2015 Add Allocation Reduce Allocation Investment Drift (No New Trades Required) Moderate 5 Performance* Moderate 5 SPY (S&P 500) Last Month -1.1% -0.3% QTD 3.3% 4.90 YTD – – Since Inception 3.3% 4.9% Std. Dev compared to SPY .63 1.0 As of 12/31/2014 Performance by ETF January 2015 Update We made 2 fairly large updates to The Moderate 5 portfolio during this reallocation, both of which focused on reducing our international exposure and increasing U.S. exposure. We have seen emerging markets really struggle lately because of the rising dollar and many EM countries, like Russia, are oil exporters, so the lower oil prices have weighed on their economy. We have replaced our Emerging Markets ETF with QQQ, which is a technology themed U.S. growth ETF. We believe that the tech sector will continue to grow in 2015 and this should be a good compliment to the Vanguard Total Stock Market ETF already in the portfolio. We also reduced the Vanguard FTSE Developed Markets ETF because we are still concerned with international exposure and would prefer to have that money in the U.S. for now. That being said, we are keeping a close eye on Europe and Japan as we think both could do well this year. Don’t be surprised if we add back to our international position later in the year as Europe, Japan, and even China have promised to keep interest rates low and money pumping into these economies as the U.S. looks to rise rates as QE is now completed. The Aggressive 5 Name Symbol Type Allocation Change Vanguard Total Stock Market Index ETF VTI Large Cap Blend 66% +1% 3 Vanguard FTSE Developed Markets ETF VEA Large Cap International 9% -1% 3 Vanguard FTSE Emerging Markets ETF VWO Emerging Markets 0% -5% 2 PowerShares QQQ ETF QQQ Large Cap Growth 10% None Vanguard REIT ETF VNQ REIT 5% None iShares Russell 2000 (NYSEARCA: IWM ) Small Cap Blend 5% +5% 1 Cash Cash 5% None Updated 1/4/2015 Add Allocation Reduce Allocation Investment Drift (No New Trades Required) Aggressive 5 Performance* Aggressive 5 SPY (S&P 500) Last Month -1.3% -0.3% QTD 4.2% 4.9% YTD – – Since Inception (10/1/2014) 4.2% 4.9% Std. Dev compared to SPY .92 1.0 Performance by ETF January 2015 Update Only 1 large change this quarter to The Aggressive 5 Portfolio which focuses on reducing our international exposure and increasing U.S. exposure. We have seen emerging markets really struggle lately because of the rising dollar and many EM countries, like Russia, are oil exporters, so the lower oil prices have weighed on their economy. We have replaced our Emerging Markets ETF with iShares Russell 2000 Index. We saw small cap companies struggle in 2014 and think that they could rebound in 2015 now that their valuations are more attractive than where they were a year ago. We believe 2015 will be a good year for the market and typically small company stocks outperform the S&P 500 in that type of environment. We didn’t make a change to the Vanguard FTSE Developed Markets ETF, but the allocation percentage dipped by 1% because of their under performance over the past quarter. As discussed above, we are keeping a close eye on Europe, Japan, and even China, as we think these economies could do well this year. *Performance is measure by Morningstar and assumes no trade commissions. Assumes trades were placed on 10/1/14 at the closing price on that day.

