Tag Archives: nysearcafdn

Forget Semiconductor ETFs, Try Other Options In The Tech Space

The technology sector saw pretty choppy trading ahead of the Q2 earnings season, with most tech ETFs falling by the wayside. The sector is likely to see lower earnings in Q2, relative to the same-period last year. The sector posted 6.2% earnings growth in Q1 while it is expected to post a decline of 4.9% in Q2. The chances of the Fed rate hike coming sometime later in 2015, global growth worries, the rout in the Chinese market, the ongoing Greek debt crisis strengthened the risk-off trade sentiment in the market and took the shine out of the cyclical tech stocks. While the impact was broad based, semiconductor stocks had to bear the brunt, having bled the most in the tech sector. The semiconductor space was investors’ darling and one of the best performing sectors in 2014, courtesy encouraging industry fundamentals. But, of late, its fundamentals have worsened with the struggling PC market. The second quarter of 2015 witnessed PC shipments falling 9.5% year over year, marking the steepest decline since the third-quarter 2013, per Gartner (read: Chipmakers Q1 Earnings Fail to Fuel Semiconductor ETFs ). A strong greenback, higher inventories in the semiconductor and electronics supply chain and the launch of Windows 10 were held responsible for this decline, per the research agency. In fact, these factors will continue to remain an overhang on PC shipments in the rest of 2015. This coupled with semiconductor giant Intel Corporation’s (NASDAQ: INTC ) underperformance wreaked havoc in the space. The INTC stock is down over 18% this year (as of July 14, 2015). Over the last one month, the stock has shed about 5.5%. Though Micron Technology’s (NASDAQ: MU ) (stock is down 44% YTD as of July 14, 2015) potential takeover deal could push semiconductors in the short term; overall sentiment remains grim. If this was not enough, IBM’s (NYSE: IBM ) successful development of 7-nanometer chips might act as another deterrent to chip market leader Intel’s growth. Semiconductor ETFs including SPDR S&P Semiconductor ETF (NYSEARCA: XSD ), Market Vectors Semiconductor ETF (NYSEARCA: SMH ), and iShares PHLX SOX Semiconductor Sector Index ETF (NASDAQ: SOXX ) were down 9.7%, 6.7% and 6%, respectively in the last one month. Where Does the Focus Shift to Now? While the semiconductor sell-off continued to weigh on the tech space, the Internet, mobile, and broad social media markets have survived the recent sell-off pretty well. Below, we have highlighted three such ETFs in detail (read: ETF Strategies for 2H ): PowerShares NASDAQ Internet Portfolio ETF (NASDAQ: PNQI ) This ETF tracks the NASDAQ Internet Index, a benchmark of about 97 companies in the Internet segment of the economy. The product has about $223.5 million in assets, though volume is a little light at around 20,000 shares a day. Internet software and services make up about 61% of the portfolio while Internet retail constitutes about 34% of the fund. Large caps do account for roughly half the assets while growth stocks account for roughly 75% of PNQI. Top three holdings include Facebook (NASDAQ: FB ), Amazon.com (NASDAQ: AMZN ) and Google (NASDAQ: GOOG ) (NASDAQ: GOOGL ) with over 25% exposure of the total. PNQI is up about 12% year-to-date and added about 3.2% in the last one week (as of July 14, 2015). However, PNQI has a Zacks ETF Rank #4 (Sell) with a High risk outlook. First Trust DJ Internet Index ETF (NYSEARCA: FDN ) This fund follows the Dow Jones Internet Index, a cap weighted benchmark of Internet companies based in the U.S. market. FDN is pretty popular with investors, as over $3.08 billion is invested in the product while average daily volume is over 260,000 shares a day. Information Technology accounts for over half the portfolio, followed closely by Consumer Discretionary at 25% of assets. Facebook (10%), Amazon (9.69%) and eBay (NASDAQ: EBAY ) (6.1%) are the fund’s top three holdings. The fund charges 57 bps in fees. The fund is up 13.4% so far this year and added over 2.8% in the last one week. The fund has a Zacks ETF Rank #3 (Hold) with a High risk outlook. iShares North American Tech-Software ETF (NYSEARCA: IGV ) This ETF provides exposure to the software segment of the broader U.S. technology space by tracking the S&P North American Technology-Software Index. The fund holds a basket of 63 securities. It is quite popular with AUM of over $1.2 billion while volume is moderate as it exchanges nearly 120,000 shares a day. The product charges 47 bps in annual fees and has gained about 9.8% so far this year. The fund was up 2.7% in the last one week. IGV has a Zacks ETF Rank #3 with a High risk outlook. Bottom Line The broader technology sector may be lagging, but not the specialized corners of Internet and software. Firms in this corner of the market have led the way higher, and have seen market-leading performances over the past week. Thus, a look at the aforementioned ETFs could be a way to earn smart gains out of a slackening sector (read: Beyond XLK: 3 Great Tech ETFs ). Original post
Wall Street Celebrates Amazon Q2: ETFs To Benefit

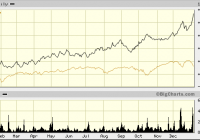
After two technology giants – Apple (NASDAQ: AAPL ) and Microsoft (NASDAQ: MSFT ) – disappointed investors early in the week, Amazon (NASDAQ: AMZN ) came up with blockbuster second-quarter results after the closing bell on Thursday. This injected fresh optimism into Wall Street. The online e-commerce behemoth reported a huge earnings beat of over 200% with a bullish outlook on the third quarter. The company earned 19 cents compared to the Zacks Consensus Estimate of loss of 15 cents per share. This represents the third consecutive quarterly earnings beat for Amazon. Moreover, the company swung back to earnings from the loss of 27 cents reported in the year-ago quarter. Revenues climbed 20% year over year to $23.2 billion and were well ahead of the Zacks Consensus Estimate of $22.3 billion. Incredible performances were primarily driven by accelerating growth in the North American market, continued strength in cloud computing business and new initiatives to lure customers to fend off competition. Notably, revenues in North America grew 26% year over year while cloud computing revenue jumped 81%. The company projects revenue growth of 13-16% for the ongoing third quarter to $23.3-$25.5 billion, the midpoint is much higher than our current estimate of $23.77 billion. The guidance includes record Prime Day sales last week. Amazon also expects operating loss of $480 million to income of $70 million compared with a loss of $544 million in the same period last year. Market Impact Based on solid results and an optimistic outlook, shares of AMZN spiked as much as 19% to a new all-time high in after marker hours. This has pushed Amazon’s market cap higher to $262.7 billion, more than the market cap of $233.5 billion of the world’s largest retailer Wal-Mart (NYSE: WMT ). Including the after-market gains, the stock is up about 82% from a year-to-date look. In addition, the stock surged 22% in the pre-market session today. Impressed by Amazon’s stellar Q2 result, many analysts revised their target prices upward on the stock. Amazon, which turned 20 on July 16, has a Zacks Rank #2 (Buy) and a solid Industry rank (in the top 40%) at the time of writing as per the Zacks Industry Rank, suggesting significant upside for the stock over the coming days. Further, the stock has a Momentum Style Score of ‘A’. The smooth trading in the stock will definitely spread into the ETF world, especially the funds with the highest allocation to this Internet giant. Below we have highlighted some of these that would be in focus in the coming days: Market Vectors Retail ETF (NYSEARCA: RTH ) This fund provides exposure to the 26 largest retail firms by tracking the Market Vectors U.S. Listed Retail 25 Index. Of these, AMZN takes the top position in the basket with 10.8% share. The ETF has a certain tilt toward specialty retail, which accounts for 30% share while hypermarkets (13%), drug stores (13%) and department stores (12%) round off to the next three spots. The product has amassed $221.6 million in its asset base and charges 35 bps in annual fees. Volume is moderate as it exchanges nearly 92,000 shares per day. RTH has gained 8.6% in the year-to-date time frame and has a Zacks ETF Rank of 1 or ‘Strong Buy’ rating with a Medium risk outlook. First Trust DJ Internet Index ETF (NYSEARCA: FDN ) This is one of the most popular and liquid ETFs in the broad technology space with AUM of $3.4 billion and average daily volume of more than 320,000 shares. The fund tracks the Dow Jones Internet Composite Index and charges 54 bps in fees per year. In total, the fund holds 43 stocks with Amazon taking the second spot at 9.7%. From a sector look, Internet mobile applications account for nearly three-fifths of the portfolio while Internet retail makes up for 26%. The ETF has surged 17.4% so far this year and has a Zacks ETF Rank of 3 or ‘Hold’ rating with a High risk outlook. P owerShares NASDAQ Internet Portfolio ETF (NASDAQ: PNQI ) This fund follows the Nasdaq Internet Index, giving investors exposure to the broad Internet industry. The fund holds about 97 stocks in its basket with AUM of $224.4 million while charging 60 bps in fees per year. It trades in light volume of around 28,000 shares a day. Amazon occupies the third position with an 8.9% allocation. In terms of industrial exposure, Internet software and services makes up for 60% share in the basket, followed by Internet retail (36.1%). PNQI is up 16.1% in the year-to-date timeframe and has a Zacks ETF Rank of 4 or ‘Sell’ rating with a High risk outlook. Consumer Discretionary Select Sector SPDR ETF (NYSEARCA: XLY ) This product offers exposure to the broad consumer discretionary space by tracking the S&P Consumer Discretionary Select Sector Index. It is the largest and the most popular product in this space with AUM of nearly $11.3 billion and average daily volume of roughly 5.7 million shares. Holding 87 securities in its basket, Amazon takes the top spot with 7.7% of assets. Media dominates more than one-fourth of the portfolio while specialty retail, hotels restaurants and leisure, and Internet retail rounding off the next three spots with a double-digit allocation each. The fund has gained about 10% so far in the year and has a Zacks ETF Rank of 2 or ‘Buy’ rating with a Medium risk outlook. Link to the original post on Zacks.com

Proof Positive That U.S. Stock ETFs Are Not The Only Place To Be

Financial professionals are blaming the latest round of risk asset uncertainty on a variety of factors, from the continuing sell-off in oil to the possibility of Greece being kicked out of the euro-zone. Still others are pointing to anxiety over the U.S. Federal Reserve’s intention to raise its overnight lending rate target in mid-2015 – the first move of its kind since December of 2008. Meanwhile, the biggest names in bonds have added fuel to the fire. Bill Gross at Janus has declared that the good times are over; he anticipates a plethora of “minus signs” in front of riskier asset classes by year-end. Similarly, Jeff Gundlach of DoubleLine believes the U.S. 10-year yield will test 1.38% from its 2.0% level. That is in sharp contrast to the unanimous verdict of economists that the 10-year would be sharply higher; the average expectation is 3.0% by December. Since the beginning of last year, I have argued the exact opposite and extolled the virtues of owning long-maturity treasuries via the Vanguard Extended Duration ETF (NYSEARCA: EDV ) and/or the Vanguard Long Term Government Bond Index ETF (NASDAQ: VGLT ). The yields on these safer havens have been more favorable than the sovereign debt of beleaguered foreign governments in the developed world. Even today, a 10-year U.S. Treasury at 2.0% compares quite favorably with German bunds (0.5%) and Japanese government bonds (0.3%). A wide variety of international and emerging market stock assets floundered in 2014, and they have continued to descend in the New Year. Yet it may come as a shock to some buy-the-dip enthusiasts that many U.S. stock ETFs have already broken below key support levels. The ones that I have identified in the chart below are currently below 200-day long-term trendlines (exponential). Paradise Lost? U.S. Stock ETFs Begin Falling Below Respective Trendlines % Below 200 Day SPDR Select Energy (NYSEARCA: XLE ) -17.1% Vanguard Materials (NYSEARCA: VAW ) -3.1% SPDR KBW Bank (NYSEARCA: KBE ) -2.0% Market Vectors Morningstar Wide Moat (NYSEARCA: MOAT ) -1.8% Guggenheim S&P 500 Pure Value (NYSEARCA: RPV ) -1.2% WisdomTree Small Cap Earnings (NYSEARCA: EES ) -0.9% RBS U.S. Midcap Trendpilot ETN (NYSEARCA: TRNM ) -0.9% Fidelity Telecom (NYSEARCA: FCOM ) -0.4% RBS U.S. NASDAQ 100 Trendpilot ETN (NYSEARCA: TNDQ ) -0.2% First Trust Internet (NYSEARCA: FDN ) -0.1% While nobody can predict whether the current flight from risk will be yet another head fake – investors have snapped up U.S. stock shares on every 4%-8% pullback since the winter of 2011 – extreme movements in both commodities and currencies in recent months do not bode well for the bulls. For example, dramatic falls in the price of crude oil historically correlate with an increase in geopolitical and economic crises. Does anyone believe that Wall Street can continue to ignore an uptick in overseas strife at the same time that the energy sector is reeling stateside? Similarly, the swift appreciation of the U.S. dollar and the quick depreciation of other world currencies over the last six months is likely to reduce the desire for carry trade activity and/or increase the desire to take some “chips off the table.” In other words, assets like the PowerShares DB USD Bullish ETF (NYSEARCA: UUP ) can be safe havens from stock turbulence, yet the ripple effects can create a desire for a reduction in risk taking across the board and an increase in desire for U.S. Treasury bonds. As an advocate for long-duration treasuries since the first week of January 2014 – as one who wrote at great length about the virtues of a barbell approach in a late-stage stock bull – I decided to investigate the unusually high positive correlation of two of my largest holdings, EDV and the Vanguard Dividend Appreciation ETF (NYSEARCA: VIG ). Historically speaking, treasuries and stocks have a slight positive correlation in good times and a strong negative correlation in bad times. That’s why 2014 represented an unlikely scenario where matching “risk-off” capital preservation with “risk-on” capital appreciation produced risk-adjusted gains that far exceeded stocks alone. Although CNBC would rather talk about the remarkable run in U.S. equities, there has been an unwillingness to address the extraordinary success of “risk-off” assets like EDV. On the contrary. The unanimous expectation for 55 of the leading economists in the country had been for the 3.0% 10-year yield to climb in 2014, with an average projection of 3.4%. It fell to 2.2.% The unanimous decision this time around is for the 10-year to rise from 2.2% to 3.0% in 2015. Alas, it is falling yet again here in the New Year. Granted, I may not be the only contrarian on middle-of-the-yield-curve rates, but I do not run a bond fund and I have plenty of stock exposure. I just know when and how to employ multi-asset stock hedging. Until we see a genuine bear scare, I do not expect tremendous coverage of the index that I helped to create with FTSE-Russell, the FTSE Custom Multi-Asset Stock Hedge Index . I affectionately refer to it as the “MASH” Index. Yet it should be noted that there are a variety of currencies, commodities, foreign bonds and U.S. bonds that have a history of exceptionally low correlations with U.S. stocks. What’s more, low correlations do not mean poor performance when stocks are soaring and great performance when stocks are struggling. It simply means that the assets move independently. That said, month-over-month, the FTSE Custom Multi-Asset Stock Hedge Index (a.k.a. “MASH”) is up 2.5% whereas the Dow logged -2.6%. Year-over-year? MASH gained 6.8% while the Dow picked up 6.3%. Granted, the last month demonstrates that multi-asset stock hedging works particularly well when stocks struggle, but it is hardly a prerequisite. The year-over-year results show that the index can garner admirable gains – better the t-bills or money markets – even in a stock uptrend. An investor can not invest in the FTSE Custom Multi-Asset Stock Hedge Index (MASH) directly yet, though an exchange-traded note is likely to appear in 2015. Do-it-yourself enthusiasts may acquire index components such as zero coupon bonds via the PIMCO 25+ Year Zero Coupon U.S. Treasury Index ETF (NYSEARCA: ZROZ ), the iShares National AMT-Free Muni Bond ETF (NYSEARCA: MUB ) as well longer-dated Treasuries in the iShares 10-20 Year Treasury Bond ETF (NYSEARCA: TLH ). Currencies like the dollar and the franc can be acquired in the CurrencyShares Swiss Franc Trust ETF (NYSEARCA: FXF ) and UUP. The index also includes gold via the SPDR Gold Trust ETF (NYSEARCA: GLD ). Disclosure: Gary Gordon, MS, CFP is the president of Pacific Park Financial, Inc., a Registered Investment Adviser with the SEC. Gary Gordon, Pacific Park Financial, Inc, and/or its clients may hold positions in the ETFs, mutual funds, and/or any investment asset mentioned above. The commentary does not constitute individualized investment advice. The opinions offered herein are not personalized recommendations to buy, sell or hold securities. At times, issuers of exchange-traded products compensate Pacific Park Financial, Inc. or its subsidiaries for advertising at the ETF Expert web site. ETF Expert content is created independently of any advertising relationships. Editor’s Note: This article discusses one or more securities that do not trade on a major exchange. Please be aware of the risks associated with these stocks.