Tag Archives: nysearcaewa

Global Stocks Shifting Positive

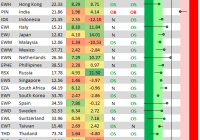
Along with the energy sector in the U.S., country ETFs around the world have experienced a big shift this week. Below you’ll see our trading range screen for the 30 largest country ETFs trading on U.S. exchanges. This screen gives you a great look at how global equity markets are trending in the near term. Last week, most of these country ETFs were below their 50-day moving averages and trending lower. This week, though, most have now re-taken their 50-day moving averages and broken their downtrends. Share this article with a colleague

Global Equities Bounce; Still Oversold

At last Wednesday’s close, global markets had pretty much all reached extreme oversold territory. Below is a snapshot of where things stand after the rally we’ve seen over the last three trading days. The screen below shows the 30 largest country ETFs traded on US exchanges. The dot represents where the ETF is currently trading within its range, while the tail end represents where it was trading one week ago. The black vertical “N” line represents each ETF’s 50-day moving average, and moves into the red or green zones are considered overbought or oversold. We’ve also included both the 3-day change and year-to-date change for each ETF. Even after the huge bounce we’ve seen, nearly half of the countries shown remain slightly oversold, and none of the countries that have bounced have moved back above their 50-day moving averages. The 50-DMA is the next resistance level for most of these ETFs to clear, so we’ll be watching closely this week to see if the resistance can be broken. Share this article with a colleague