Tag Archives: nysearcaeps

After Value, Dividend And Quality, Momentum Has Also Started To Lag

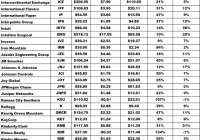
Summary Large groups of Value, Dividend and Quality stocks have been lagging the market for one year. Momentum was a good place to hide until September. The last weeks have been harmful for Dividend and Quality stocks. A previous article published on 9/1 pointed out that groups of stocks broadly selected on value, dividend and quality criteria have been lagging the benchmark since the 3rd quarter of 2014. To spare you the time of reading it, this was the conclusion: In the recent months, a wide outperformance of momentum stocks has been detrimental to value, dividend and quality stocks. The recent correction was beneficial to dividend stocks excess return, but value and quality are still lagging. This fashion in momentum explains why a lot of investors with portfolios based on value and quality factors have underperformed the market in the recent months. The trend started in June 2014, and accelerated in June and July 2015. This phenomenon is not limited to a small group, it is widely spread in the 100 best stocks of the S&P 500 index (NYSEARCA: SPY ) in each investing style category. These categories are simplified by taking the top 20% of the S&P 500 ranked on a unique factor. The top 20% of value stocks is defined as the 100 S&P 500 stocks with the lowest price/earnings ratio (P/E trailing 12 months, excluding extraordinary items). The top 20% of dividend stocks is defined as the 100 S&P 500 stocks with the highest yield. The top 20% of quality stocks is defined as the 100 S&P 500 stocks with the highest return on equity (ROE trailing 12 months). The top 20% of momentum stocks is defined as the 100 S&P 500 stocks with the highest price increase in 1 year (250 trading days). Variations in the relative performance of such large groups of stocks may be random on short periods. When they are consistent on long periods, they denote a behavioral change in the market. My aim here is to observe and quantify this change, not to explain it. Hereafter you can see the equity curves and statistics of the four “top 20%” groups for the last 3 months. The lists are updated and equal-weighted on market opening of the first trading day every week. Dividends are reinvested. Top 20% Value: (click to enlarge) Top 20% Dividend: (click to enlarge) Top 20% Quality: (click to enlarge) Top 20% Momentum (click to enlarge) The next table gives the annualized excess return over SPY of the top 20% group for each category since 1/1/1999, then on the last 12 months, 6 months, 3 months and 1 month. Annualized excess return of the top 20% stocks in… Since 1999 Last 12 months Last 6 months Last 3 months Last month Value 6.89% -7.67% -12.58% -10.4% -12.99% Dividend 5.37% -4.22% -5.93% -2.6% -34.16% Quality 4.91% -2.53% -7.49% -9.69% -30.14% Momentum 3.63% 4.45% 6.45% -2.2% -16.64% The long term outperformance of all groups confirms that investors following any of these investing styles can get a positive statistical bias. This has been documented in countless academic publications. Value investing has an edge over other styles. However, value stocks have been lagging for more than 1 year (since June 2014 exactly). The sector meltdown in energy and some basic materials companies is an incomplete explanation: it is accountable for less than half of the negative excess return of value stocks on this period. The relative loss has accelerated a bit in the last month. Dividend and quality stocks have also been lagging for at least one year, and their underperformance has accelerated considerably in the last month. Momentum stocks have been outperforming their own historical excess return for at least 1 year, but they did worse than SPY in the last 3 months, and especially in the last month. Conclusion Until September, we could interpret the situation as a transfer of excess return from value, quality and dividend to momentum. Lately, momentum has also underperformed and the benchmark index has done better than the 4 groups of stocks representing classic investing styles. After looking at data before the 2 major downturns since 1999, my previous article concluded that such patterns don’t seem to be clues to identify a market top. There are cycles of variables amplitudes and time frames in asset classes, sectors and investing styles. On the long term, value, dividend, quality and momentum offer a statistical bias. On the short term, investors following quantitative or discretionary strategies based on these styles may experience more frustration before getting back their edge. Updates I plan to publish updates on investing styles performance. If you don’t want to miss the next one, click “follow” at the top of this article. Data and charts: portfolio123

SPDR S&P 500 ETF (SPY) Analysis: Using CapFlow And FROIC

Summary Analysis of the components of the SPDR S&P 500 ETF (SPY) using my CapFlow and FROIC ratios. Specifically written to assist those Seeking Alpha readers who are using my free cash flow system. Part II will concentrate on “Main Street” while Part I in the series concentrated on “Wall Street”. Back in late December I introduced my free cash flow system here on Seeking Alpha, through a series of articles that you can view by going to my SA profile . My purpose in doing so was to try and teach as many investors as I could on how to do this simple analysis on their own as I believe in the following: “Give a person a fish and you feed them for a day, Teach a person to fish and you feed them for life” I have been very pleased with the positive feedback that I have received so far, but included in that feedback were many requests by those using my system, to see if they did their analysis correctly or not. Since the rate of these requests have been increasing with every new article I write, I have decided to start a new series of articles here on Seeking Alpha analyzing the SPDR S&P 500 ETF (NYSEARCA: SPY ), where I will analyze each of its components individually. That way those of you using my system will have something like a “teacher’s edition” that will give you all the correct calculations for each component. Obviously I can’t include the results for all my ratios in one article, so I will thus be doing a series of articles, where each ratio’s results for the SPDR S&P 500 ETF will have its own article devoted to it. Hopefully these articles can be used as reference guides that everyone can use over and over again, whenever the need arises. Having said that, I would suggest that everyone first read Part I by going HERE . There you will find the data on my “Free Cash Flow Yield” ratio which is one of three parts that I use it tabulating my final “Scorecard”. While free cash flow yield is a Wall Street ratio (Valuation Ratio), this article with concentrate on my “CapFlow” and “FROIC” Ratios, which are Main Street ratios. The final Scorecard results will be available in Part III of this series and basically combines all three ratio results to generate one final result. Once completed, my scorecard should give everyone a clearer understanding on how accurate the valuation is that Wall Street has assigned each company relative to its actual Main Street performance. Before we show you the final results of our two Main Street ratios, here is brief introduction to what each of the two ratios, which make up my system as well as what the final “Scorecard” score mean. CapFlow CapFlow is the name I have given to the ratio (Capital Expenditures/Cash Flow). CapFlow allows us to see how much capital spending (or capital expenditures, CAPEX) a company must employ in relation to its cash flow to maintain itself and more importantly grow the company. This ratio is extremely useful as it is both a qualitative and quantitative ratio in that it acts as a laser beam into the inner workings of a company. Quite simply if a company is increasing its profits and doing so by spending less money relative to its growth in cash flow, it should, in theory, outperform on Main Street. When you can have such an occurrence for more than a few years in a row, it clearly shows you have wonderful management in place that knows what it is doing. The ideal again is to consistently have a CapFlow of less than 33% and avoid any company, like the plague, that has a CapFlow of over 100%, as in such a case management is spending more in capital expenditures than it is bringing in from cash flow from operations. That is a recipe for disaster in my opinion. Just using this ratio alone will narrow your list of potential candidates for investment substantially and will give you an easy-to-use tool for judging management effectiveness. FROIC FROIC = Free Cash Flow Return on Invested Capital FROIC= Free cash flow/ (long-term debt + shareholders equity) FROIC basically tells us how much return in free cash flow a company generates for every one dollar of “Total Capital” it employs. I consider FROIC the primary determining factor in identifying growth companies as one can compare every company on an equal basis using this ratio. The question I ask every company I analyze is: “How much return (in percent) in free cash flow are you going to give us for every dollar of total capital you invest?” A FROIC of 20% or more is considered excellent and the higher the result the better. Since long-term debt is included in the invested capital part of the equation, one can see quite clearly by using this ratio, on just how well or how poorly management is managing its debt. So without further ado here are my results for the CapFlow and FROIC ratios for the components that make up the SPDR S&P 500 ETF : Always remember that the results shown above are just for two ratios and that this is not investment advice, but just the results of the ratios. The system outlined in this article and all that will follow, as part of this series, are just meant to be used as reference material to be included as just “one” part of everyone’s own due diligence. So in other words, don’t make investment decisions based on just these two results, but incorporate them as part of your own due diligence.

S&P 500 FCF Analysis: What You Do Depends On Who You Are

Analysis of the S&P 500 Index and its individual components using the “Free Cash Flow Yield” ratio. Specifically written to assist those Seeking Alpha readers who are using my free cash flow system. Generates a final result for the S&P 500 Index and explains that result to each reader depending an what type of investor they are. Back in December of last year, I introduced my free cash flow system here on Seeking Alpha, through a series of articles that you can view by going to my SA profile . My purpose in doing so was to try and teach as many investors as I could, on how to do this simple analysis on their own, as I believe in the following: “Give a person a fish and you feed them for a day, Teach a person to fish and you feed them for life” I have been very pleased with the positive feedback that I have received so far, but included in that feedback were many requests by those using my system, to see if they did their analysis correctly or not. Since the rate of these requests has been increasing with every new article I write, I have decided to start a new series of articles here on Seeking Alpha analyzing the S&P 500 Index, where I will analyze each of its components individually. That way those of you using my system will have something like a “teacher’s edition” that will give you all the correct calculations for each component. Obviously I can’t include the results for all my ratios in one article, so I will thus be doing a series of articles, where each ratio’s results for the S&P 500 Index will have its own article devoted to it. Hopefully these articles can be used as reference guides that everyone can use over and over again, whenever the need arises. Having said that, at the same time we will be “killing two birds with one stone” as we will also be analyzing the S&P 500 Index and give one final result for it as well as its individual components . That way these series of articles will also be able to give us a real time analysis of whether the S&P 500 Index is attractively priced or overvalued. In order to save space in this article (as the table that will soon follow is quite long) I would welcome everyone to read my article on how to analyze a portfolio/Index by clicking on the following link first: Warren Buffet s Berkshire Hathaway Portfolio: A Free Cash Flow Analysis That way those of you who are new to this analysis will get a complete introduction and for others already familiar with my work, let it act as a refresher course. This article with concentrate on my “Free Cash Flow Yield Ratio” Free Cash Flow Yield = Free Cash Flow per Share / Stock Market Price One key point to always remember in using this system, is that it is designed for all kinds of investors, whether you would be conservative (like I am) or a more aggressive/buy & hold investor. I have created the following parameters for each type and they are as follows: Finally it is also important to understand that I personally do not invest in financial firms as a rule, because it is quite difficult to get a very accurate free cash flow result. This is so because financial firms generate very little in the way of capital expenditures, thus the results you find below are basically just cash flow from operations. I still analyze them as they are part of the S&P 500 Index, but again I don’t invest in them as I find financial firms too complicated to analyze. This belief of not investing in financials, saved me from suffering the huge losses that this sector suffered in 2008-2009, which cost investors dearly. For those who disagree we can start a discussion on the matter in the comment section below, which will allow me to further elaborate on the matter. So without further ado here is my “Free Cash Flow Yield Analysis of the S&P 500 Index (NYSEARCA: SPY ) and its components: (click to enlarge) The final free cash flow yield result of 5.11% for the S&P 500 Index would be classified as a ” Strong Hold” for the more aggressive/ buy & hold investor and a “Weak Sell” for the more conservative investor, using the parameter tables I included at the beginning of the article . The weightings that you see in the index were generated by mirroring those used in the SPDR S&P 500 ETF . Also remember that the results shown above are just for one ratio and that this is not investment advice, but just the results of the ratio. The system outlined in this article and all that will follow, as part of this series, are just meant to be used as reference material to be included as just “one” part of everyone’s own due diligence. So in other words, don’t make investment decisions based on just this one result, but incorporate it as one part of your own due diligence.