Tag Archives: nysearcadxj

Portfolio Report Card: A $1.23 Million Portfolio Built On The Wrong Foundation

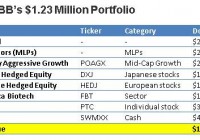
By Ronald Delegge From an observer’s viewpoint, the individual with a good sized investment portfolio (say above $1 million) doesn’t have much to worry about. They’ve got lots of money and that’s all that matters. Unfortunately, this misinformed view isn’t just dead wrong, but it incorrectly presumes the person with a large portfolio has done everything right. Is it true? First, let’s be explicitly clear: Being a good accumulator doesn’t automatically make a person a good investor. And based upon what I’ve seen, the number of good savers easily outnumbers the quantity of good investors. In other words, having a large investment portfolio is a wonderful convenience, but it doesn’t necessarily mean that your investments are correctly invested or properly aligned. My latest Portfolio Report Card is for BB, a late 60s retiree living in Naples, FL. He manages his own investments and told me he watches his money “like a hawk.” BB’s $1,236,939 million portfolio consists of a taxable brokerage account that contains one hedge fund, one mutual fund, one individual stock, three ETFs, a managed portfolio of energy master limited partnerships (MLPs), and some cash. BB asked me to do a Portfolio Report Card analysis to find out the strengths and weaknesses of his investments. What kind of grade does BB’s portfolio get? Let’s analyze and grade it together. Cost Investing is not a cost-free activity and your net performance is directly tied to how well or poorly you contain the cost of your investment portfolio. Sadly, most people are so distracted that minimizing trading activity, cutting fund expenses, and reducing other unnecessary fees isn’t a priority. BB’s portfolio owns one hedge fund, one separately managed account, one mutual fund, three ETFs, one individual stock, and cash. The mutual fund and ETF holdings have asset weighted expenses of 0.57% while the separately managed MLP account charges 1%. The cost of this portfolio is 65% more expensive compared to our ETF benchmark. Put another way, BB has too much fat in his portfolio. Diversification The hallmark of genuinely diversified investment portfolios is broad market exposure to the five major asset classes: Stocks, bonds, commodities, real estate, and cash. How does BB’s portfolio do? His portfolio has exposure to U.S. and international stocks, energy MLPs and cash. However, the portfolio lacks broad diversification to stocks because the funds he owns like the First Trust NYSE Arca Biotechnology Index ETF (NYSEARCA: FBT ) are sector focused. Likewise, the other funds he owns like the WisdomTree Japan Hedged Equity ETF (NYSEARCA: DXJ ) and the WisdomTree Europe Hedged Equity ETF (NYSEARCA: HEDJ ) engage in tactical strategies that concentrate exposure in a certain segment of the stock market. The same is true of his PRIMECAP Odyssey Aggressive Growth Fund (MUTF: POAGX ), which only owns a narrow segment of the stock market, mid-cap growth stocks. Although BB owns energy MLPs, this only covers one narrow segment of the entire commodities market. In summary, BB’s portfolio comes up short on diversification because of its highly concentrated, plus it lacks broad exposure to three major asset classes: real estate, commodities, and bonds. Risk Your portfolio’s risk character should always be 100% compatible with your capacity for risk and volatility along with your financial circumstances, liquidity requirements, and your age. BB’s overall asset mix of this total portfolio is the following: 76% stocks, 20% energy MLPs and 4% cash. Clearly, BB’s exposure to equities is elevated for his age group and doesn’t leave him much cushion if market conditions suddenly change. Although BB is financially versed, his risk management techniques could use an overhaul. Put another way, a 20% to 40% stock market decline would expose BB’s portfolio to potential market losses of $188,000 to $375,000. Tax Efficiency Smartly designed investment portfolios are always aggressive at reducing the threat of taxes. This can be achieved by owning tax-efficient investment vehicles like index funds or ETFs along with using smart asset location strategies. BB told me he’s been using tax losses carried over from previous years to offset his current portfolio’s tax liabilities. While this is good, the tax efficiency of BB’s portfolio can still be better. For example, the energy MLPs are not a tax-efficient asset yet they’re held in a taxable investment account. Performance Your portfolio’s performance is indeed the bottom line, but it’s never the only line. That’s because your performance return – good or bad – is directly impacted by your portfolio’s cost, risk, diversification, and taxes. How does BB’s portfolio do? This portfolio gained $27,000 (BB withdrew $60,000) and its one-year performance return from JAN 2014-JAN 2015 was (7.12%) vs. a gain of +3.77% gain for the index benchmark matching this same asset mix. Investment performance should match or exceed the benchmark and BB’s one-year performance is satisfactory. The Final Grade BB’s final grade is “C” (weak). Although BB’s one-year performance return was satisfactory, his performance is largely attributable to lots of luck along with a cooperative stock market versus financial acumen. Furthermore, it’s highly doubtful that BB’s equity heavy portfolio would deliver satisfactory performance in a different market climate. BB’s portfolio scored poorly at minimizing cost, maximizing diversification, and having a risk profile that is age-appropriate. Fixing these portfolio defects should be his priority. I’m especially concerned that BB has made non-core assets like hedge funds, sector ETFs, and tactically niche equity funds core components within his portfolio. This is a fundamental error. Substituting highly concentrated or leveraged non-core assets in the place of broadly diversified core assets inside your core portfolio is comparable to building a home on unstable terrain. In summary, if BB fixes the weaknesses within his portfolio, I believe satisfactory performance returns should become a regular thing versus a one-year anomaly. Ron DeLegge is the Founder and Chief Portfolio Strategist at ETFguide. Ron’s Portfolio Report Card grading system has been used to evaluate more than $100 million in portfolios and helps people to identify the strengths and weaknesses of their investment account, IRA, and 401(k) plan. Disclosure: No positions unless otherwise indicated Link to the original post on ETFguide.com
Europe’s QE Experiment: Adding Stock ETF Exposure And Hedging Against The Unforeseen

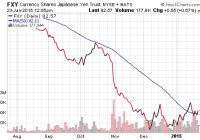
The scope and size of the European Central Bank’s latest stimulus effort has delighted the worldwide investing community. The countries/regions that are in the process of actively weakening their currencies are seeing the greatest pop in near-term equity prices. All of the safer haven currency proxies have gained ground in 2015, whereas the overwhelming majority of global growth-oriented currency ETFs are hittng 52-week lows. The scope (current euro-zone member nations) and size ($1.1 trillion euros) of the European Central Bank’s latest stimulus effort has delighted the worldwide investing community. In fact, many began betting on a monumental quantitative easing “project” the minute that Europe registered year-over-year deflation of -0.2% for the month of December. This can be seen in dollar-denominated ETF performance since the start of the 2015. The Anticipation Game: Investors Bet On Most Recent “QE” Beneficiaries Approx YTD% iShares Currency Hedged MSCI Germany ET F (NYSEARCA: HEWG ) 8.5% Deutsche X-trackers MSCI Europe Hedged Equity ETF (NYSEARCA: DBEU ) 4.3% WisdomTree Korea Hedged Equity ETF (NASDAQ: DXKW ) 0.9% WisdomTree Japan Hedged Equity ETF (NYSEARCA: DXJ ) 0.3% SPDR S&P 500 Trust ETF (NYSEARCA: SPY ) 0.0% The outperformance by Germany as well as Europe over less recent “quantitative easers” is worthy of note. It tells us that the countries/regions that are in the process of actively weakening their currencies – the ones that are actively lowering the costs of servicing their sovereign debt by the most significant amounts via ultra-low yields – are seeing the greatest pop in near-term equity prices. Indeed, the vast majority of currency ETFs are hitting 52-week lows. The ones that are not? The safer haven currency proxies which include the CurrencyShares Swiss Franc Trust ETF (NYSEARCA: FXF ), the CurrencyShares Japanese Yen Trust ETF (NYSEARCA: FXY ), the PowerShares DB USD Bull ETF (NYSEARCA: UUP ) and SPDR Gold Trust ETF (NYSEARCA: GLD ). All of these safer haven currency proxies have gained ground in 2015, whereas the overwhelming majority of global growth-oriented currency ETFs are hittng 52-week lows. Safer Haven Proxies Are Flourishing, Global Growth Proxies Are Languishing Approx YTD % FXF 13.5% GLD 9.1% UUP 4.8% FXY 1.7% CurrencyShares Australian Dollar Trust ETF (NYSEARCA: FXA ) -2.5% CurrencyShares British Pound Sterling Trust ETF (NYSEARCA: FXB ) -3.6% CurrencyShares Canadian Dollar Trust ETF (NYSEARCA: FXC ) -6.3% CurrencyShares Euro Trust ETF (NYSEARCA: FXE ) -7.0% For those who do not understand why the yen strengthens in risk-off environments, you may need a refresher on the “carry trade.” Investors borrow the low yielding yen to invest in higher yielding assets or higher appreciating assets. However, there is a serious consequence for playing the game at the wrong time; specifically, the yen rise in value when institutions and hedge funds rapidly sell stocks, higher-yielding bonds and higher-yielding currencies to avoid paying back loans in a more expensive yen. The Japanese currency can rise rapidly and the reverse carry trade can take on a life of its own. During January’s volatility in U.S. stock assets, FXY has crossed above its 50-day moving average. If the risk off volatility has truly run its course due to the European Central Bank’s mammoth QE promise and the Bank of Japan’s existing promises, FXY should stabilize rather than climb. Conversely, additional gains for FXY would suggest additional unwinding of the yen carry trade as well as a high probability of heavy volume selling of stock assets. The potential for the carry trade to unwind and the yen’s historical record as a safer haven currency is the reason for its inclusion in the FTSE Custom Multi-Asset Stock Hedge Index. This index that my Pacific Park Financial colleague and I created with FTSE-Russell- the one that many are already calling “MASH” – holds the franc, yen, dollar and gold. It also owns long maturity treasuries, zero coupon bonds, inflation-protected securities, munis, German bunds and Japanese government bonds. Year-to-date, the FTSE Custom Multi-Asset Stock Hedge Index is up 4.5%. Shouldn’t investors just play market-based securities in a way that has worked so well during the Federal Reserve’s QE3? The shock-and-awe, 1.5 trillion dollar, open-ended, bond-buying bazooka that gave U.S. stocks double-digit percentage gains in 2012, 2013 and 2014? After all, the European Central Bank (ECB) is proffering $1.1 trillion euros into 2016. The problem in the comparison between these programs is that 80% of the sovereign bonds are being bought by the national central banks and not the the ECB itself. This means that each country (e.g., Austria, Belgium, France, Germany, Greece, Italy, Spain, etc.) is responsible for its own default risk. It follows that I might be willing to add a fund like HEWG to my barbell portfolio , alongside several existing components such as the iShares S&P 100 ETF (NYSEARCA: OEF ), the Health Care Select Sect SPDR ETF (NYSEARCA: XLV ) and the Vanguard Dividend Appreciation ETF (NYSEARCA: VIG ). I might be a bit more skeptical of the i Shares Currency Hedged MSCI EAFE ETF (NYSEARCA: HEFA ), simply because of the drag of extreme debtors on the periphery of Europe (e.g., Spain, Portugal, Greece, etc.). By the same token, I have slowly increased exposure over the last three months to a number of existing holdings on the other side of the barbell. They include GLD, the i Shares 10-20 Year Treasury Bond ETF (NYSEARCA: TLH ), the Vanguard Extended Duration Treasury ETF (NYSEARCA: EDV ) and, more recently, FXY. Remember, multi-asset stock hedging does not mean that your dynamic hedging loses when riskier stock assets win. On the contrary. Both sides of the barbell tend to perform in late-stage bulls. Disclosure: Gary Gordon, MS, CFP is the president of Pacific Park Financial, Inc., a Registered Investment Adviser with the SEC. Gary Gordon, Pacific Park Financial, Inc, and/or its clients may hold positions in the ETFs, mutual funds, and/or any investment asset mentioned above. The commentary does not constitute individualized investment advice. The opinions offered herein are not personalized recommendations to buy, sell or hold securities. At times, issuers of exchange-traded products compensate Pacific Park Financial, Inc. or its subsidiaries for advertising at the ETF Expert web site. ETF Expert content is created independently of any advertising relationships.