Tag Archives: nysearcadjp

Paring The Leaders, ETF Performance Review: Major Asset Classes

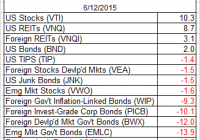
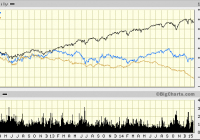
The U.S. equity market has regained front-runner status for the trailing one-year return (250 trading days) among the major asset classes, but the edge is looking considerably less impressive compared with the glory days of recent years. In fact, rolling one-year returns overall are a diminished lot lately, based on our standard set of ETF proxies that track broad measures of the global opportunity set. There are fewer positive returns for the trailing 250-day period while the performance histories that are still in the black reflect relatively modest gains vs. recent history. In short, earning a risk premium isn’t getting any easier. That’s another way of saying that there’s more red ink weighing on the one-year profiles. Ten of the 14 ETFs that track the major asset classes have lost ground over the past 250 trading days. One thing that hasn’t changed: the deeply bearish trend for commodities in broad terms. The iPath Dow Jones-UBS Commodity Index Total Return ETN (NYSEARCA: DJP ) is still the big loser, shedding nearly 28% over the past year. Here’s a graphical recap of the relative performance histories for each of the major asset classes for the past 250 trading days via the ETF proxies. The chart below shows the performance records through June 12, 2015, with all the ETFs rebased to a year-ago starting-value of 100. U.S. equities are again in the lead (blue line at top), but the edge is razor thin over U.S. real estate investment trusts (black line), which is the number-two performer at the moment. Meanwhile, let’s review an ETF-based version of an unmanaged, market-value-weighted mix of all the major asset classes – the Global Market Index Fund, or GMI.F, which holds all the ETFs in the table above. Here’s how GMI.F stacks up for the past 250 trading days through June 12, 2015. This investable strategy is ahead by just 1.7% over that span – well below the performance for U.S. stocks, via the Vanguard Total Stock Market ETF (NYSEARCA: VTI ) and slightly behind the 2.0% return for U.S. bonds via the Vanguard Total Bond Market ETF (NYSEARCA: BND ). Comparing the median dispersion for rolling 250-day returns for the major asset classes via ETFs suggests that the general rebalancing opportunity has fallen for GMI.F vs. recent history after surging in recent months. Analyzing the components of GMI.F with a rolling median absolute deviation via one-year returns for the ETFs implies a moderately diminished potential for adding value by reweighting this portfolio in comparison with recent history. Keep in mind that the implied opportunity for productive rebalancing will vary depending on the choice of holdings and historical time window. Also, any given pair of ETFs may present a significantly greater or lesser degree of rebalancing opportunity vs. analyzing GMI.F’s components collectively, which is the methodology that’s reflected in the chart below. Note, too, that the chart focuses on looking backward. If you’re confident in your forecast for risk and return, the ex ante view of rebalancing opportunity may paint a distinctly different outlook vs. an ex post analysis. Finally, let’s compare the rolling one-year returns for the ETFs in GMI.F via boxplots to review performance momentum in the context of recent history. The gray boxes in the chart below reflect the middle range of historical 250-day returns for each ETF – the 25th to 75th return percentiles. The red dots show the current 250-day return (through June 12) vs. the equivalent from 30 trading days earlier (blue dots, which may be hiding behind red dots in some cases). For instance, the chart shows that the U.S. stock market is currently the top performer among the major asset classes, as shown by red dot. But in a sign of the times, the current performance is a touch below VTI’s median return (horizontal black line).
How Long Before ‘They’re Raising Rates’ To ‘They’re Considering QE4?’

If foreign economic stagnation and commodity price depreciation is an old story, then why are U.S. equities suddenly responding as though the U.S. economy might be in danger? The daily volatility over the last 10 weeks is primarily attributable to the Federal Reserve terminating its third iteration of “QE” back in October. The central banks of the world have been remarkably successful at repressing the risk of equity market participation. The media are telling us that U.S. stocks have been under pressure this January due to global growth fears and an accompanying rout across the entire commodity space. Yet that only tells a small part of the story. After all, the S&P 500 SPDR Trust ETF (NYSEARCA: SPY ) has performed quite admirably over the past three years, blissfully unresponsive to the global growth woes reflected in ETFs like the Vanguard FTSE Emerging Markets ETF (NYSEARCA: VWO ) and the iPath Dow Jones-UBS Commodity Index Total Return ETN (NYSEARCA: DJP ). If foreign economic stagnation and commodity price depreciation is an old story, then why are U.S. equities suddenly responding as though the U.S. economy might be in danger? Where’s the enthusiasm for the enormous stimulus associated with cheap oil and gas? What happened to the euphoria over the best job growth since 1999? In truth, the daily volatility over the last 10 weeks is primarily attributable to the Federal Reserve terminating its third iteration of “QE” back in October – an electronic money creating, bond-buying program that resulted in the Fed acquiring trillions in U.S. debt. Consider the reality that when the Fed removed a large portion of the supply of treasuries, investors who would have bought those treasuries had to buy assets like corporate bonds instead. This reduced the borrowing costs for corporations and allowed many of them to refinance debts as well as buy back shares of their own stock. Up went the stock market. Similarly, the Fed removed a large portion of the supply of mortgage-backed securities, ultimately lowering the mortgage costs for real estate. Up went the housing market. An increase in the net worth of corporations, small businesses as well as wealthier families did create an atmosphere for greater economic confidence. However, with the Federal Reserve hinting that overnight lending rates might go up as soon as April, butterflies flapping their wings in Rio de Janeiro and Beijing have been creating tremors for U.S. equities. In essence, the stock market is not so sure that our “booming” domestic economy is a self-sustaining wonderland in the absence of central bank stimulus. Nowhere is this more obvious than in the relatively tranquil progress of the FTSE Custom Multi-Asset Stock Hedge Index. In the ten weeks since QE ended (through Jan 14), the index has quietly gained 2.5% while the S&P 500 has fluctuated wildly on its way to being flat. (Note: These results do not yet account for Wednesday’s stock declines.) While the bullish media typically ignore the bulk of what happens with non-equity asset classes, there are specific currencies, commodities and country debt that have historically performed well in moderate-to-severe stock downturns. Asset types like longer-term treasuries, zero-coupon bonds, munis, German bunds, gold, the franc, the yen, the dollar and others fit the bill. The index, often referred to by others as the “MASH Index,” does not short or use leverage like a bear fund; safer haven holdings (ex stocks) often perform better than cash in stock uptrends as well. You can learn more about the FTSE Custom Multi-Asset Stock Hedge Index at StockHedgeIndex.com . Those investors who remain in the bullish camp theorize that the U.S. economy is strong enough to handle modest rate increases. They also anticipate the inevitability of quantitative easing or similar asset-back purchasing measures in the euro-zone as well as China acting to bolster its economic output through a variety of techniques; stock bulls view the troubles overseas as noise and vow to continue buying dips on weakness. In contrast, bears counter with the fact that U.S. stocks are not only at the high end of historical valuations, they may be at the highest levels in recorded history. For instance, Jim Paulsen at Wells Capital explained that U.S. stocks have never been this expensive ever, at least not when one employs the median price-to-earnings ratio. (And Paulsen has been a fixture in the bull camp!) My view? I am neither bullish nor bearish in practice. That said, I am a proponent of applying insurance principles to the investing process. Stop-limit loss orders , trendlines, put options, multi-asset stock hedging – they all minimize the risk of catastrophic loss. Indeed, the reason I partnered with the world’s largest index provider (FTSE-Russell) in developing the FTSE Custom Multi-Asset Stock Hedge Index was to offer a new way to reduce the risks associated with stock market euphoria. The central banks of the world have been remarkably successful at repressing the risk of equity market participation. Throughout the six years of the 2009-2015 bull, whenever there has been a belch (or even a hiccup), the Federal Reserve has come to the rescue with more bond-buying stimulus. On the flip side, if they stick to their guns on raising rates this time, you can expect the uncertainty to fuel even more desire for perceived safe havens. You might look at the iShares 10-20 Year Treasury Bond ETF (NYSEARCA: TLH ) as well as carry trade reversal beneficiaries like the CurrencyShares Japanese Yen Trust ETF (NYSEARCA: FXY ). If the conversation shifts towards “no rate increases until 2016″ or even “a bit more QE is a possibility,” then the unbridled excitement for stock ownership would pump new life into the aging bull. Disclosure: Gary Gordon, MS, CFP is the president of Pacific Park Financial, Inc., a Registered Investment Adviser with the SEC. Gary Gordon, Pacific Park Financial, Inc, and/or its clients may hold positions in the ETFs, mutual funds, and/or any investment asset mentioned above. The commentary does not constitute individualized investment advice. The opinions offered herein are not personalized recommendations to buy, sell or hold securities. At times, issuers of exchange-traded products compensate Pacific Park Financial, Inc. or its subsidiaries for advertising at the ETF Expert web site. ETF Expert content is created independently of any advertising relationships.