Tag Archives: nysearcadia

Does The Presidential Cycle Have A Significant Impact On Stock Market Performance?

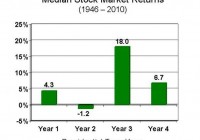
Summary The third year of a presidential cycle has historically offered outsized returns. In this study, data for 1928 to 2014 were analyzed to evaluate the effect of the presidential cycle on S&P 500 performance. Given that we are currently in Obama’s third year (of his second term), should we be expecting significant gains ahead? Introduction In a previous article entitled ” The January Effect Revisited And A Call For The Use Of Elementary Statistics “, I made the case that assertions of outperformance should be supported by elementary statistics. In the case of the January effect, I analyzed monthly data from 1988 to 2014 to show that the standard deviation of monthly returns was actually very large compared to the average return for any given month, rendering most of the observed seasonal deviations to be statistically insignificant. Yet, the absence of error bars on the most popular graphs illustrating the January effect means that investors studying the chart would be unable to ascertain whether [i] the outperformance is statistically significant and [ii] whether or not the increased return is worth the risk. The article ended with an exhortation for all analysts to incorporate simple statistical analysis into their charts. In the present article, we analyze another phenomenon that may be playing out at the present time: the impact of the presidential cycle (also known as the election cycle) on stock market performance. The following charts are top hits in a Google search for “presidential cycle stock market”. (Source: GoBankingRates ) (Source: Murray Financial Group ) (Source: Seeking Alpha ) (Source: John Rothe ) All four charts show the 3rd year of a president’s term to be the best in terms of stock market performance, and the 2nd year to be the worst. Interestingly, the last chart seems to show that the final quarter of the 2nd year actually delivers the best performance out of all 16 quarters in the presidential cycle. Now, what are all four charts missing? If you had read the previous article (or the introduction) you would know that the answer is “error bars”. Given that we are currently in the 3rd, and presumably “best”, year of Obama’s presidency (the second term), I was interested to determine whether or not the presidential cycle has a statistically significant impact on stock market performance. Results and discussion Yearly total return performance for S&P 500 (NYSEARCA: SPY ) from 1928 to 2014 was obtained from Aswath Damodaran . For the purposes of this study, the four-year presidential cycle is assumed to occur continuously even though there have been interruptions with certain presidents. For example, Gerald Ford’s first year in the office in 1974 would still be counted as the second year of the presidential cycle (since it would have been Richard Nixon’s 6th year in office). The S&P 500 annual total return distribution from 1928 to 2014 shows a bell-like shaped curve with a negative skew, from which the dreaded “left tail” can be observed. Yet, it should be noted that 63 out of the 87 years (or 72.4%) in this study have had positive returns. The average return over the 87 years was 11.53%, while the median return was 14.22%. This is one reason why “buy-and-hold” has worked so well for the average investor in the U.S. market. First let’s have a look at the average performance of the stock market over the four-year presidential cycle. (click to enlarge) Consistent with the charts presented in the introduction, we find that the 3rd year of the presidential cycle provides the greatest performance, with an average performance of 17.57% (and median of 22.34%). Moreover, the 3rd year was the only year that outperformed the average overall return of 11.53% (and median of 14.22%). The other three years all underperformed the average, with the 2nd year having the lowest return of 8.80% (and median of 10.00%), again consistent with previous charts. The next chart shows the data for average returns but with the inclusion of error bars representing the standard deviation of the results. (click to enlarge) We see that the standard deviation of the annual returns is larger than the actual returns (though not overwhelmingly so), indicating significant variability in the results. One way to visualize these error bars is to assume that about 68% (or just over two-thirds) of the data points lie between the error bars. A t-test was conducted to investigate whether or not the annual returns of each year of the presidential cycle is significantly different from the overall average return of 11.53%. The results are shown in the table below.   1st 2nd 3rd 4th Mean 8.99% 8.80% 17.57% 11.03% Standard deviation 22.01% 21.21% 18.90% 17.20% p-value 0.594 0.553 0.158 0.893 Significant? No No No No The results of the t-test show that none of the years of the presidential cycle are significantly different from the average year. A number of commenters in the previous article mentioned that because the return distribution is not exactly normal (there is some skewness or kurtosis), an alternative test such as the Wilcoxon test should be performed. Therefore, I also calculated the p-value using the one-sample Wilcoxon signed-rank test to determine whether the median returns for each year of the presidential cycle was significantly different from the overall median return of 14.22%.   1st 2nd 3rd 4th Median 7.40% 10.00% 22.34% 13.35% p-value p> 0.10 p> 0.10 p> 0.10 p> 0.10 Significant? No No No No Similarly, the one-sample Wilcoxon signed-ranked test shows that none of the observed performances were significant. (It is noted that the Wilcoxon test assumes a symmetrical distribution, which is not perfectly valid for the present distribution. I considered the one-sample sign test, but that test does not capture the magnitude of differences from the median. If anyone knows another simple one-sample, non-normal, non-symmetric test that can be used instead, please let me and the readers know!) C onclusion While the 3rd year of a presidential term has delivered, on average, outsized returns for the past 87 years (from 1928 to 2014), any deviations between any of the years of the presidential cycle and the average or median return were found to be insignificant. Note that statistical tests such as these do not “disprove” the presidential cycle effect, nor do they prevent you from profiting (or attempting to profit) from the perceived opportunity. What the tests do tell you is that for the past 87 years, any impact that the presidential cycle has had on stock market returns is indistinguishable from chance. Therefore, this article ends with another call for analysts to incorporate simple statistical analysis into their presentations. This information would allow investors to evaluate [i] whether the outperformance is statistically significant and [ii] whether or not the increased return is worth the risk. Author’s note: On a personal level, I was rather disappointed in the outcome of this study. Given that we are currently in the 3rd year of the presidential cycle, I was really hoping that the effect would be significant. I guess that’s confirmation bias creeping in!
When Picking Stocks, It’s Good To Be Lucky.

Summary There are very few human endeavors that do not involve any element of luck. Investing is no exception luck plays a role. When judging the luck vs. skill ratio in a game an interesting test is to try to lose. The harder it is to intentionally lose, the less skill the game requires. The same test can be applied to investing. I suggest we give it a try. Have you ever played a game with a young child and tried to lose, only to find yourself having to cheat to allow the toddler to win? That’s because most games for very young children have a very low skill component. A few years later perhaps you’re teaching the child to play checkers or chess. Now it is very easy to lose intentionally. The more skill a game requires the easier it is to lose intentionally. (Being competitive I find it very difficult to lose intentionally to anyone over six – a sad but true commentary on my personality.) This can also be applied to stock picking. If stock picking is mostly based on skill, it should be easy to pick stocks that trail the market. I propose we put the theory to the test by having a contest to see who can pick a portfolio that will trail the market over the next year. Let’s start February 1st, to give everyone a chance to select their stocks and to give me a chance to find a place to post and share the portfolios. Before I give the rules of the contest I want to discuss skill and luck a little. First, let’s look at the definition of skill from Merriam-Webster: Skill: The ability to use one’s knowledge effectively and readily in the execution of performance. Skill is not based only on the outcome. The outcome can be the result of luck. I have known investors who have made a lot of money by making large bets on a small number of stocks and letting those bets ride. Was it skill? It’s hard to know. I do know that if enough investors participate in the market in that manner some of them will get rich even if no skill is involved. If we have a coin flipping contest and define flipping heads as winning: If you flip a coin 10 times the chances that you end up with 60% heads or greater are approximately: 38%. If you flip a coin 20 times the chances that you get 60% heads or greater is about 25%. If you flip the coin 100 times the chances of getting 60% heads or greater is approximately 3%. If at least part of investment returns are based on luck, an investor who does not make a lot of bets has a better chance of out performing the market by a large amount. An investor can limit his bets by only selecting a limited number of stocks. An investor can also limit his number of bets by investing only in a single industry, sector, market cap etc. Of course, making fewer bets also means you have a better chance of under performing the market by a large amount. Which is why my portfolio is diversified; it is not that important to me to have outsized gains, but it’s very important to me to avoid outsized losses. I will also note that the reason the market involves so much luck is actually because most of the participants are highly skilled. If you sit down at a poker table with a bunch of rubes your skill at poker will almost guarantee you win. If everyone at the table has the same skill level, skill evens out and luck becomes a much larger factor. Now back to our contest.. Each contestant should select a portfolio of twenty stocks from the S&P 500. The stock must be diversified with two stocks from each sector: Consumer Discretionary Consumer Staples Energy Financials Health Care Industrials Information Technology Materials Telecommunications Services Utilities Each stock gets equal weighting and the entire portfolio is invested in these equities – no bonds no cash. The portfolio is created in La-La land where there are no expenses and no taxes. The goal is to select a portfolio that will trail the S&P 500 in total return over the next year. Send me a message with your selections. I will post the selections somewhere where we can monitor our progress. I will post the location on an insta-blog. The contest will start Feb. 1 2015 and end Feb. 1 2016. Is this a perfectly formulated study? No, far from it. Even I, who am not a researcher can point out a lot of flaws, but I think it will be interesting and challenging, and in spite of its flaws, we may learn something. Conclusion It is difficult to tell luck from skill when judging investment returns. Portfolios that lack diversification have a better chance of either greatly outperforming or greatly underperforming the market. If we account for this, by forcing the selection of a diversified portfolio, a skilled stock picker should still be able to create a portfolio that will under perform the market. Let’s give it a try and see how we do.

Dow 20,000: Is 2015 The Year?

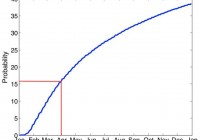
Jeremy Siegel suspects the Dow might hit 20,000 in 2015. There is a (unconditional) 38.6% chance that the Dow closes out 2015 above 20,000. Find out the probability that the Dow will close above 20,000 any day during the year in the analysis below. It’s that time of year again. Yup, that jolly, happy time of year when the soothsayers of Wall Street start trumpeting their views on what’s going to happen in 2015, and how to position portfolios to profit. Esteemed Wharton professor, Jeremy Siegel, author of the permabull bible, Stocks for the Long Run , recently joined the merry parade with his own forecast that Dow 20,000 ‘could happen’ in 2015. Astute investors might take stakes now in large manufacturers of confetti, party horns, and streamers. But I digress. We don’t make forecasts on this blog, but it is constructive to understand generally what the range of probable outcomes might be. Is our hero, Dr. Siegel, taking a brave stand against the bearish hordes, or is he making safe proclamations from behind a sturdy statistical moat? We aim to find out. First, the low hanging fruit. What is the unconditional probability that the Dow Jones Industrial Average, which closed 2014 near 18,000, closes out 2015 above 20,000? First, let’s assume that returns are normally distributed and iid . Next, let’s take long-term average (arithmetic) U.S. stock returns to be 5.3% per year (this is the average 12 month arithmetic price-only returns to U.S. stocks from the Shiller worksheet – remember, index returns do not include dividends), with annual standard deviation of 20%. If the mean annual return to the price index is 5.3%, then the unbiased expected value of the Dow at the end of 2015 is 18,000 * 1.053= 18,950. A finish at 20,000 would represent a return of 20,000/18,000 = 0.111 or 11.1%, which is 11.1% – 5.3% = 5.8% more than expected. Given the standard deviation of returns is 20%, this represents a 5.8/20 = 0.29 standard deviation event. We can now apply the cumulative normal distribution function to determine the probability of a positive 0.29 sd event. In Excel, it is 1 – NORM.S.DIST(0.29,TRUE) = 0.386, or 38.6% So the unconditional probability that the Dow closes at 20,000 or greater at the close on the last trading day of 2015 is almost 40%. This is not quite a coin toss, but Jeremy is not exactly going out on a limb. Keep in mind that stock market price returns approximate a geometric random process. They don’t just climb in a steady curve, and close each day at a new high. Surely Jeremy would take credit for his “Dow 20,000″ call if the index exceeds the magical 20,000 threshold at any point during the year, even if it doesn’t actually finish the year above this level. For simplicity however, let’s just examine the probability that it closes above 20,000 on any trading day of the year; so we won’t take into account intra-day periods. Recall that if the annualized return is 10%, then the expected return at the close on day 1 is (using a 252 trading day year): 1.053^(1/252)-1 = 0.0002, or 0.02% with a range of 20% * sqrt(1/252), or 1.26% Were the Dow to close at 20,000 on trading day 1, that would represent an 11.1% return in 1 day. Given the 1 day expected return is 0.02%, with a 1 day SD of 1.26%, this would be a (0.111 – 0.0002) / 0.0126 = 8.8 standard deviation event. The probability of a positive 8.8 sd event under a normal sample distribution is a decimal number preceded by 20 zeroes. Essentially no chance. But that’s just on day 1. What about on day 63, which is about 3 months into the year? The expected return after 63 days is 1.053^(63/252)-1 = 1.3%, with a standard deviation of 20% * sqrt(63/252) = 10%. Were the Dow to have risen 11.1% to close at 20,000 on trading day 63 (about the end of March), that would represent a (0.11 – 0.013)/0.1 = 0.98 standard deviation event. The probability of a positive 0.98 standard deviation event is about 16.3%. Now we are talking a 1 in 6 chance that the Dow hits 20,000 at the end of March, the same odds as throwing a 6 on a standard die. The following chart was formed by performing essentially the same analysis at each daily period, and shows the probability that the Dow will meet or exceed 20,000 at the close of each sequential trading day of the year. We highlighted the 16.3% probability at a 3 month horizon described above for illustrative purposes. Figure 1. Probability of Dow > 20,000 at each sequential trading day of 2015 (click to enlarge) We now know the probability of the Dow closing above 20,000 on any given day, but we still haven’t answered the question, “What is the probability that the Dow closes at or above 20,000 at any time in 2015?” To answer this, first consider Figure 2, which shows just 20 of the virtually infinite number of possible paths for the Dow over the next year, given our mean return and standard deviation assumptions. Figure 2. Sample paths for the Dow in 2015 (click to enlarge) By visual inspection we can see that a substantial portion of the potential paths in Figure 2 cross above 20,000 at some point during the year. We ran a Monte Carlo simulation of 1 million possible paths, and discovered that about 64% of paths would cause the index to rise above 20,000 at some point during the calendar year. Particularly astute readers may recognize that the former problem, where we solved for the probability of a price exceeding a specific value at a certain point in time, is a problem of similar nature to that of solving for the value of a European call option, which can be exercised only at expiration. This problem has a known closed-form analytical solution. In contrast, the latter problem has elements that are similar to finding the value of an American call option, which can be exercised at any time up to and including expiration. This problem has no known closed-form solution, and must be solved numerically or by simulation, such as our Monte Carlo method. It’s critical to understand the random element in stock market activity so that we don’t get so emotionally attached to silly milestones. There is a 64% chance that the media and the top 0.01% will be able to break out party hats and champagne this year to celebrate an arbitrary milestone in a poorly constructed index. Siegel isn’t making a bold statement; far from it. Rather, he is playing the (unconditional) odds. And that is precisely what you should do as an investor. The question is: do you feel lucky? We can think of a few reasons why you shouldn’t feel so sanguine, and might humbly suggest a better way of thinking about markets anyway.