Tag Archives: nysearcadia

The Great ETF Crash Of 2015

There’s no other way around it — last Monday morning, a large portion of the U.S. ETF market experienced a structural crash. How else would you categorize it when an ETF like the S&P 500 equal-weighted RSP fell 43% on decent volume and took over 30 minutes to recover? This ETF tracks the 500 stocks in the S&P 500 on an equal-weighted basis instead of on a cap-weighted basis, and its underlying index was down well under 10% at its lows on Monday morning. Other U.S.-index tracking ETFs fell 30%+ as well. The S&P Smallcap 600 IJR fell 30% at its lows, while the Smallcap 600 Growth IJT fell 34%. Even the Nasdaq 100 ETF QQQ was down 17.25% at one point, while its underlying index was down just 9% at its lows. Below is a look at our key ETF matrix that shows the recent performance of various asset classes. In this matrix, we highlight the one-day performance (%) of ETFs at their lows on Monday morning, their performance from their lows on Monday morning to their closing levels that day, and their performance from their lows on Monday morning through today. RSP is now up 75% from its lows! It’s worrisome that the ETF asset class could experience such extreme drops given how big the market has become. We strongly recommend against keeping active stop orders in the market unless you fully expect them to get hit, and avoid “market orders” at all times unless you’re monitoring the bid/ask spreads very closely. Lots of people got burned on Monday morning, and if you were one of them, you likely could have dodged it by following these two rules. Share this article with a colleague

Wild Week In The Market And How Investing Is Like Buying Groceries

Last week, along with some sharp turns in the market, came some interesting comments on Federal Reserve policy and markets from Ray Dalio, the investment guru and world’s largest hedge fund manager. Dalio, the founder of Bridgewater Associates feels that the Federal Reserve, while they may raise interest rates soon, will be forced to enact another round of Quantitative Easing (QE). QE is the purchase of assets by the Federal Reserve to stimulate the economy. It increases the size of the Fed’s balance sheet and provides support to equity prices. Much like in 1936, the Fed finds themselves painted into a corner and addicted to quantitative easing. In 1936 the Fed raised rates for the first time since the 1929 stock market crash and that tighter monetary policy caused a recession which sent equity prices tumbling. Will the Fed do that again? They are certainly trying to avoid that but must get interest rates above zero. Dalio expects a major easing from the Fed. Could we see rising interest rates courtesy of the Federal Reserve AND QE? We are contingency planners and must provide for all outcomes. On Monday of last week the S&P 500 was over 4 standard deviations away from its 50 Day Moving Average (DMA). That is a level that would denote an extreme move in a short amount of time. The last time that this occurred was in August of 2011 when the United States sovereign debt was downgraded. The following week the S&P 500 rallied over 7%. We felt that Monday was an appropriate time to put cash to work for our more aggressive clients. By the end of the week we had seen a 6.3% rally in the S&P 500 from its lows and we felt that taking some profits in a tax efficient manner was appropriate. History has shown that sharp selloffs like this tend to have reflex rallies that are prone to failure. Having seen sharp declines investors are likely to scale back risk exposure and that produces overhead resistance to stock prices. We would not be shocked and are quite prepared for the downside in prices to resume this week. Now is a very good time to reassess one’s appetite for risk and whether that is commensurate with one’s risk exposure. If you didn’t sleep well last week you need to have less risk in your portfolio. If the market selloff didn’t interfere with your zzzz’s or you felt like buying on the dip then your risk is either okay or could be increased. Take some time and think about how you reacted last week. It is going to be another fun filled week. These are the times that we thrive on and live for. Dislocations in markets provide opportunity. You can see things as problems or opportunities. If you are prepared then it is an opportunity. We are prepared with an underweight in equities and quite happy with market moves lower and dislocations. We are shopping for groceries and want to see lower prices. As Warren Buffett has often said, “Why would anyone want higher stock prices”? Know that we have room in our basket and are looking for groceries in the discount aisle. Share this article with a colleague

Is More Information Making Us Worse Investors?

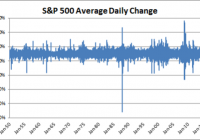
Study after study has shown that retail investors and professional money managers just aren’t very good at investing. And the primary cause of this poor performance is being overly active and incurring lots of unnecessary taxes and fees. The pros can’t control themselves because they have to impress their clients by trying to look active and “beat the market.” And the retail investor is prone to be short term because they know their financial lives are a series of short-term financial events in a long-term life. But an interesting thing appears to be occurring over the course of the last 65 years. Despite a preponderance of information and market access, we seem to be getting no better at investing AND the markets seem to be getting more volatile. If we look at the average daily change in the S&P 500, we can see a slight shift in the variance of the data over time: That’s not very clear, though. If we rearrange that chart, we can construct the average annualized standard deviation of the daily returns: This chart clearly shows that stock market volatility has increased over the last 65 years. There is almost certainly a multitude of causes here, but I don’t think it’s a coincidence that the 1980s and the era of new technology and market access has coincided with the explosion in higher volatility since then. This makes me wonder about two things: What does this say about information theory, economic theory and financial theory? What does this tell us about the current era of investing? What does this say about information theory, economic theory and financial theory? One would think that more information would make the markets behave more “efficiently.” And while we know that professional investors don’t beat the market consistently, we also know that the average holding time on stocks has cratered over the last 70 years, which means that investors, in the aggregate, are paying more in taxes and fees than they previously did. In fact, the average holding period is now consistent with a short-term capital gains rate which means the business of active investing has become a lucrative business for Uncle Sam! This means, by definition, that the post-fee and post-tax return on the aggregate of publicly-held stocks has to be lower than it was in 1940. This would seem to imply that easier access to markets and information has actually made us worse at investing. More information isn’t making us more rational or more efficient. It’s fueling our behavioral biases and short-term tendencies. Access to trading accounts combined with the 24-hour news cycle has become a behavioral nightmare for investors. And yet the vast majority of investors think that all of this information is making them smarter when the data shows that they’re not nearly as financially competent as they think. Contributing to this is all the new technologies. This includes discount brokerage firms, high-frequency trading, leveraged index funds, robo advisors, free trading applications, etc. All of these businesses feed off of our “get rich quick” mentality and/or give us access to markets in an unprecedented manner which fuels our behavioral biases in any number of ways. Further, investors haven’t been compensated for this added volatility. The average 3-year return on the S&P 500 is only marginally higher in the last 25 years than it is over the last 65 years. This shows how futile the idea of “risk” as “standard deviation” really is. In other words, the textbook model of the financial markets hasn’t at all reflected what one might have expected where more information makes markets more efficient, and more volatility compensates investors for what is considered more risk. Basically, modern financial theory doesn’t tell us much about modern financial reality. What Does This Tell us About the Modern Era of Investing? Nothing good. I’ve talked about the difficulty of managing time in one’s portfolio . This intertemporal conundrum is, by a wide margin, the most difficult concept to master in portfolio management. This is the problem of time in an investor’s portfolio. While we know we should be long term, we are inclined to be short term for any number of reasons. Threading that needle and finding the timeframe that makes the most sense for you is incredibly difficult. I’d venture to guess that investors in the 40s probably weren’t far off with their 7-year period. Sadly, what I seem to be finding is that more and more investors are veering in the direction of being ultra short term, hoping to make the quick risk-free buck. And in doing so, they’re falling victim to all of the behavioral biases that are driving this extremely short-term view which necessarily leads to poor performance.