When Hedging Makes A Difference
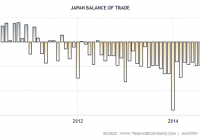
The fund takes advantage of hedging a strong U.S. Dollar against a weak Japanese Yen. The fund is heavily weighted towards industrial and auto manufacturers; major Japanese exports. The fund is passively managed with over 300 companies in the fund. Japan has been struggling to inflate its economy for decades. Immediately after his 2012 reelection, Japanese Prime Minister Mr. Shinzo Abe initiated a ‘three arrow plan’ consisting of fiscal stimulus, monetary easing and structural reforms all intended to attain a 2% annualized inflation rate. Although it was unprecedented and did have an immediate positive effect, the plan soon lost velocity. Complicating the matter, the massive 2011 earthquake and Tsunami which led to the destruction of the Fukushima reactors forced the government to order an immediate shutdown of all nuclear facilities. To replace the lost power generation, oil and gas imports increased dramatically, and by 2012 the increase in fuel imports had created a large trade deficit as demonstrated in the chart. (click to enlarge) Further, a value added tax increase caused consumers to reduce spending. At the very end of October 2014, BOJ Governor Mr. Haruhiko Kuroda unexpectedly announced a sizable expansion of the bank’s existing bond buying program. The Japanese Government Pension Fund simultaneously announced plans to double equity holdings. However, nearly 10 months later, chronic disinflation still persists in the Japanese. Recently, the IMF has called for Japan to expand its stimulus measures still further opining that the Bank of Japan’s current projections are “overly optimistic”. However, Mr. Kuroda considers that the growth policy remains on track and no further actions are required. Is this the right time to have exposure to the Japanese economy in your portfolio? Note though, it isn’t just the Japanese economy investors need to be concerned with. All economies phase in and out of business cycles. However, because of the extreme quantitative stimulus measures implemented for such an extended length of time, and often quite unexpectedly, it would be better to enter a position with a currency hedge. Deutsche Asset & Wealth Management offers the X-tracker MSCI Japan Hedged Equity ETF (NYSEARCA: DBJP ) . The fund’s objective is to track the performance, ” of the MSCI Japan U.S. Dollar Hedged Index. The index is designed to provide exposure to Japanese equity markets, while at the same time mitigating exposure to fluctuations between the value of the U.S. dollar and Japanese yen … ” The index is 100% hedged to the U.S. Dollar, selling Yen forward contracts at the one month forward rate. Should the Yen depreciate, the tracking index as well as the fund’s Net Asset Value is hedged against losses. Consumer Discretionary leads the fund’s sector allocation at 22.26% with 57 holdings, followed by Financials at 19.64% with 53 holdings; Industrials, 19.48% with 67 holdings; Information Technology, 11.14% with 41 holdings; Consumer Staples, 6.67% with 20 holdings; Health Care, 6.30% with 21 holdings; Materials, 5.92% with 28 holdings; Telecom Services, 4.96% with 4 holdings; Utilities, 2.45% with 11 holdings and Energy 0.91% with 5 holdings. (Data from Deutsche Asset & Wealth Management) The fund is weighted towards cyclical industries 47.45%, followed with cyclically sensitive industries at 23.66% and lastly, 16.83% are in defensive holdings. (Data from Deutsche Asset & Wealth Management) Of the 10 most heavily weighted companies, 66% are in cyclical industries, 21% are semi-cyclical and 13% are defensive. (Data from Deutsche Asset & Wealth Management) The leading fund holding is Toyota Motor Corp (NYSE: TM ) , at 6.16% of the fund, 28.166% of the top ten, and 27.668% of all the 58 Consumer Discretionary holdings. The second largest Consumer Discretionary in the top ten is also an auto manufacturer, Honda Motor (NYSE: HMC ) at 1.84%, accounting for 8.41% of the top ten and 8.264% of all consumer discretionary holdings. It’s important to note that the fund’s 10 motor vehicle manufactures add up to 10.425% of the net asset value. This means that 46.833% of the fund’s consumer discretionary holdings are auto manufacturers. Its then worth noting that automobiles and vehicle parts make up over 18% of Japanese exports. (click to enlarge) (Data from OEC) Lastly, almost 35% of Japan’s exports to the U.S. are autos and vehicle parts and just over 9% of the same to China. Hence a sizable portion of the fund is dependent on U.S. and Chinese automobile demand. The fund’s second heaviest weighted sector is financials at 19.64%, numbering 56 institutions. The largest in the top ten are Mitsubishi Financial (NYSE: MTU ) at 3.11%, Sumitomo Mitsui Financial (NYSE: SMFG ) at 1.91% and Mizuho Financial Group (NYSE: MFG ) at 1.65%. These three financials combined comprise 29.96% of the top ten holdings and 33.98% of all financial holdings. Once again, an important caveat needs to be stated here as well. Because of the Bank of Japan’s extraordinary QE policy, Japan’s banks are seeking higher yields overseas, and thus may be incurring higher risk. As noted in the Financial Times last April: … ultra-low BOJ interest rates are causing at Japan’s regional lenders, which have significant deposits but few lending opportunities because of their ageing local customer base…With 10-year JGB yields at 0.34 per cent, regional banks are investing in overseas sovereign debt or buying real estate funds in search of a yield pick-up.. The fourth largest sector is industrials at 19.48% of the fund. Within the top ten, one industrial, Fanuc LTD (FANUY ) , 1.49%, comprises 6.69% of the top ten and 7.649% of the fund’s 67 industrial holdings. Consumer Staples rank 5th at 6.67% and represented by Japan Tobacco ( OTCPK:JAPAY ) at 1.30%, 5.84% of the top ten and 19.23% of all consumer staples. Health Care follows at 6.30% represented by Takeda Pharmaceutical Co ( OTCPK:TKPYY ) at 1.25% of the top ten and 3.251% of all 21 Healthcare holdings. Lastly, Telecommunications is represented in the top ten by KDDI ( OTCPK:KDDIY ) , 1.29%; 5.79% of all top ten holdings and 62% of all telecom holdings. A trade profile of Japan reveals that, as noted, Autos are the lead export at 13%; Vehicle Parts, 5.3%; Integrated Circuits, 2.4%; Industrial Printers, 2.2% and Specialized Machinery, 1.7%. Of total exports to China, Integrated Circuits are 7.51%, followed by Vehicle Parts, 5.10% and Autos, 4.04%. Of total Japanese exports to U.S. Autos are 27.57% followed by Vehicle Parts, 7.40%; industrial Printers, 2.57%; Construction Vehicles, 2.41% and Aircraft Parts 2.33%. South Korea receives a sundry of intermediate industrial products, such as Hot Rolled Iron, 4.60; Raw Plastic Sheeting, 4.45% and Integrated Circuits, 3.90%. Exports to Thailand, a major Automobile manufacturing and assembly center, are Vehicle Parts, 11.59%; Engine Parts, 3.64% and Combustion engines, 2.22%, as well as intermediate iron. Lastly, according to the World Trade Organization, Japan accounts for 3.13% of Commercial Service exports and 3.70% of Commercial Service imports. Hence, automobiles, automobile components, heavy industrial machinery and construction equipment are important to Japan’s economy. Current Bank of Japan policy is maintaining a weaker Yen, with pressure mounting to stimulate the economy even more. This policy makes Japanese export products less expensive to the importers. Since the U.S. is a major importer of Japanese autos and heavy equipment, the Yen/Dollar hedge will offset the risk of a weakening Yen. Further, strengthening U.S. consumer spending bodes well for Japanese auto and electronics manufacturers. (click to enlarge) There are several USD/JPY hedged funds in this space. Based on the best one year returns of the top ten Japan focused funds, five are focused on a specific sector, two on subsets of the broader indices and the remaining three, including the X-Tracker fund are based on the broader indices. A summary comparison of the three broad based indices is presented in the table below. Fund/Inception Tracking Index 1 Year Return Total Assets Shares Outstanding Premium / Discount Distribution Yield Fees Recent Price P/E iShares Currency Hedged MSCI Japan ETF ( HEWJ) 1-31-14 MSCI 27.16% $830.7 million 26.4 million Discount at -0.08% 1.17% 0.48% after waiver $31.68 16.00 DBJP 6-9-11 MSCI 26.39% $1.358 billion 32.00 million Discount at -0.87% 1.74% 0.45% $42.03 17.00 WisdomTree Japan Hedged Equity ETF ( DXJ) 6-16-06 WisdomTree 25.04% $17 billion 314.6 million Discount at -0.49% 2.28% 0.48% $56.47 14.00 The fund is relatively new, having initiated trading in June of 2011. The market yield to date return is 16.42% and the trailing twelve month yield is 11.46% According to the prospectus , the fund is at least 80% invested and tracks the MSCI Japan U.S. Dollar Hedged Index, based on a subset of the Japanese Equity Market. There are 1,891 top tier companies and 3,486 in total in that index. Over the three years the fund has paid dividends totaling $6.55/share, the largest distribution, $3.42849, paid in December of 2014. The fund is currently trading at a slight discount to NAV at -0.87%. The extreme measures the BOJ needed to make weakened the currency considerably against the U.S. dollar. As it is now, it seems that the Yen will remain weak against the dollar for some time to come. Lastly, although the U.S. economy is growing it is doing so at a very moderate pace, whereas China’s rapid expansion seems to have come to a sudden halt, and might even be contracting. However, if indeed contracting, it offers Japan the opportunity to regain its status as the second largest global economy; an important point to consider. Disclosure: I/we have no positions in any stocks mentioned, and no plans to initiate any positions within the next 72 hours. (More…) I wrote this article myself, and it expresses my own opinions. I am not receiving compensation for it (other than from Seeking Alpha). I have no business relationship with any company whose stock is mentioned in this article. Additional disclosure: CFDs, spread betting and FX can result in losses exceeding your initial deposit. They are not suitable for everyone, so please ensure you understand the risks. Seek independent financial advice if necessary. Nothing in this article should be considered a personal recommendation. It does not account for your personal circumstances or appetite for risk.