Tag Archives: nysearcadbc

Updating The Baker’s Dozen Portfolio: A Slight Modification Of The IVY 10

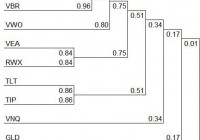
Constructing a portfolio with as few as 13 ETFs. Reduce risk by introducing a “circuit breaker” ETF. Finding low correlated ETFs. A slight modification to the IVY 10 Portfolio. The Baker’s Dozen Portfolio was first presented approximately three months ago. This is an update of that momentum model which is a slight modification of the IVY 10 Portfolio. While the Baker’s Dozen includes 12 ETFs plus SHY , the cutoff ETF, it could easily be paired down to 10 as VOE and VBR are highly correlated with VTI . As with the IVY 10 Portfolio, it does not take many ETFs to provide global diversification. In this portfolio VEA is selected as the Developed International Equity instead of VEU since VEU also contains emerging market stocks. The asset class, Emerging Markets is covered by using VWO . This removes a little duplication that shows up in the IVY Portfolio. PCY is part of the Baker’s Dozen in an effort to spread the risk from domestic to international securities. Gold (NYSEARCA: GLD ) is included in the Baker’s. Otherwise the holdings compared to the IVY 10 are similar. The following thirteen ETFs were selected for their diversity and low correlations. Vanguard Total Stock Market ETF VTI – This ETF covers the entire U.S. Equities market and therefore should be part of any portfolio that uses ETFs for core investments. Vanguard Mid-Cap Value ETF VOE – As a mid-cap value ETF, this security is highly correlated with VTI, but is included to provide a value tilt to the portfolio as recommended in the Fama-French five factor model (FF-5). Vanguard Small-Cap Value ETF VBR – In keeping with the FF-5, this ETF is added even though it too is highly correlated with VTI. If one were to simplify this portfolio, VOE and VBR are the two ETFs to eliminate from the Baker’s Dozen. Vanguard FTSE Developed Markets ETF VEA – For our developed international equities ETF we select VEA. Vanguard FTSE Emerging Markets ETF VWO – VWO is our emerging market ETF of choice. If one wishes to further simplify the portfolio it is possible to merge VEA and VWO and use only VEU as that ETF includes emerging market stocks. Vanguard REIT ETF (NYSEARCA: VNQ ) – Domestic Real Estate is included as an inflation hedge and it provides a good source of income. SPDR Dow Jones International RelEst ETF (NYSEARCA: RWX ) – International Real Estate provides an additional hedge to inflation and it adds another asset class with good income. PowerShares Emerging Markets Sov Dbt ETF PCY – Emerging markets sovereign debt is a different type of security and is added for both diversification and high yield. PowerShares DB Commodity Tracking ETF (NYSEARCA: DBC ) – Commodities is another asset class and serves as a low correlation asset when compared with VTI. SPDR Gold Shares GLD – Precious metals is yet another asset class that has a low correlation with our equity holdings such as VTI, VOE, and VBR. iShares 20+ Year Treasury Bond (NYSEARCA: TLT ) – This 20+ Treasury instrument provides backing from the U.S. Government and adds additional diversity to the portfolio. iShares TIPS Bond (NYSEARCA: TIP ) – TIPs are included as another inflation hedge. This ETF also has a low correlation with equity securities. iShares 1-3 Year Treasury Bond SHY – This Treasury ETF is our cutoff or “circuit breaker” security as this management model seeks ETFs that are performing above SHY and sells ETFs that are under-performing SHY. These ETFs were selected for low correlations as shown in the cluster diagram below. As mentioned above, VOE and VBR are highly correlated with VTI and are the first places to simplify this portfolio. ETF Rankings: The following ranking table contains many risk reducing clues. The primary one is to stay away from ETFs that are ranked below SHY. Currently, that includes Commodities and Gold . A secondary risk reducer is to sell the security when it is price below its 195-Day Exponential Moving Average. VEA and DBC would be sold on that basis. Back-testing indicates better returns are obtained when one concentrates the portfolio in a few ETFs rather than spreading out investments over a larger number of holdings, even if they are performing above SHY. For a number of weeks, VNQ and TLT have been the stars of the Baker’s Dozen. (click to enlarge) Performance Graph: The following performance graph is a recent example of how a portfolio made up of just a few well-diversified ETFs performed since early October of 2014. This graph is from the Rutherford Portfolio and readers can click on the link to learn more about the management of this portfolio. Portfolios are reviewed every 33 days and in the case of the Rutherford, rebalancing moved equal percentages of the portfolio into the top two holdings. If this were to be rebalanced today, we would hold 700 shares in VNQ and 450 shares in TLT in this $125,000 portfolio. These figures are rounded. (click to enlarge) Disclaimer: The above graph will not likely continue this wide divergence from the VTTVX benchmark. 1) The time period is very short for this “live” portfolio. 2) I do not expect TLT to continue its excellent performance. Over the last month there were days when TLT was running in the opposite direction of the market and this aided the overall performance of the Rutherford. It is expected that these momentum managed portfolios will outperform the market when the next severe bear market strikes. That will be the real test of this risk reducing model. Disclosure: The author is long VNQ, TLT, VTI, RWX. (More…) The author wrote this article themselves, and it expresses their own opinions. The author is not receiving compensation for it (other than from Seeking Alpha). The author has no business relationship with any company whose stock is mentioned in this article.
ETFReplay.com Portfolio Update

The ETFReplay.com Portfolio holdings have been updated for February 2015. I previously detailed here and here how an investor can use ETFReplay.com to screen for best performing ETFs based on momentum and volatility. The portfolio begins with a static basket of 14 ETFs. These 14 ETFs are ranked by 6 month total returns (weighted 40%), 3 month total returns (weighted 30%), and 3 month price volatility (weighted 30%). The top 4 are purchased at the beginning of each month. When a holding drops out of the top 5 ETFs it will be sold and replaced with the next highest ranked ETF. The 14 ETFs are listed below: Symbol Name RWX SPDR DJ International Real Estate PCY PowerShares Emerging Mkts Bond WIP SPDR Int’l Govt Infl-Protect Bond EFA iShares MSCI EAFE HYG iShares iBoxx High-Yield Corp Bond EEM iShares MSCI Emerging Markets LQD iShares iBoxx Invest Grade Bond VNQ Vanguard MSCI U.S. REIT TIP iShares Barclays TIPS VTI Vanguard MSCI Total U.S. Stock Market DBC PowerShares DB Commodity Index GLD SPDR Gold Shares TLT iShares Barclays Long-Term Trsry SHY iShares Barclays 1-3 Year Treasry Bnd Fd In addition, ETFs must be ranked above the cash-like ETF SHY in order to be included in the portfolio, similar to the absolute momentum strategy I profiled here . This modification could help reduce drawdowns during periods of high volatility and/or negative market conditions (see 2008-2009), but it could also reduce total returns by allocating to cash in lieu of an asset class. The top 5 ranked ETFs based on the 6/3/3 system as of 1/31/15 are below: 6mo/3mo/3mo LQD iShares iBoxx Invest Grade Bond VNQ Vanguard MSCI U.S. REIT TLT iShares Barclays Long-Term Trsry TIP iShares Barclays TIPS SHY Barclays Low Duration Treasury Since all of the current holdings are still ranked in the top 5 there is no turnover this month. In 2014 I introduced a pure momentum system, which ranks the same basket of 14 ETFs based solely on 6 month price momentum. There is no cash filter in the pure momentum system, volatility ranking, or requirement to limit turnover – the top 4 ETFs based on price momentum will be purchased each month. The portfolio and rankings will be posted on the same spreadsheet as the 6/3/3 strategy. The top 4 six month momentum ETFs are below: 6 month Momentum TLT iShares Barclays Long-Term Trsry VNQ Vanguard MSCI U.S. REIT LQD iShares iBoxx Invest Grade Bond VTI Vanguard Total U.S. Stock Market The top 4 ETFs are the same as last months, so there is no turnover for February. Disclosures: None How did this change your view of ? More Bullish More Bearish It Didn’t This impact ( ) More Bullish More Bearish Unchanged Thanks for sharing your thoughts. Submit & View Results Skip to results » Share this article with a colleague

Risk-Neutral Vs. The Real World: Wall Street Traders Really Are From A Different Planet

Risk-neutral versus real-world pricing and valuations matter. Risk-neutral traders are less active, leading to trading and investment opportunities. Interest rates drive growth and inflation expectations, not the other way around. Traders at the big Wall Street banks have their own culture, language, idioms and superstitions. They have a peculiar code of ethics, ideals and standards of behavior. Indeed, they even have unique and privileged access to markets and information that both ordinary and sophisticated investors are envious of. It is like they come from and inhabit a different planet from the rest of us. It turns out the traders at the big banks do, in fact, belong to another world. Readers of a quantitative inclination will recall that sell side traders operate in what is called the Q, or “risk-neutral” world, whereas the buy side – that means the rest of us – function in the P, or “real world.” The distinction between the two worlds – the P and Q – is profound, and is also gaining increased importance. That is because the Q World, occupied by the traders at the sell-side banks, is under intense pressure to reduce risk taking activities. There is also a culling of Malthusian proportions going on at Wall Street trading desks, in effect depopulating the Q World. The table below describes the differences between the two worlds: The P World The Q World Goal Predict the future Extrapolate the past Environment Real world probability Risk Neutral probability Process Discrete time series Continuous time martingales Dimension Infinite Finite Tools Econometrics, statistics Ito calculus, SDEs Challenges Parameter estimation Calibration Business Buy Side Sell side Density ratio or ∏ =q/p should be a monotonically decreasing function of market returns. Source: Meucci 2011, CGA Research. The key point to note here is that sell-side traders, or the Q-World, do not really need to worry about future market returns. The sell-side model is based upon a cost-plus replication strategy that simply buys and sells securities at prices where risk is neutralized by various hedging strategies. As long as markets are reasonably complete and liquid, the sell side can isolate itself against future price developments. The sell side only gets into trouble when it moves away from the Q-World and risks its own capital speculating in the P-World. Now that we understand the two worlds, the question becomes what happens when Q-World goes away or its market power is greatly diminished? We have already seen and heard about disruptions and lack of liquidity in various bond markets since Q-World retrenched in the aftermath of the 2008 financial crisis. More recently, we see the effects in the oil markets where an unprecedented exodus from commodity markets by the big banks has contributed to the drastic fall in oil prices. Is it simply a coincidence that headline oil prices have declined by upwards of 50% during the same time that Morgan Stanley (NYSE: MS ), JPMorgan Chase (NYSE: JPM ), Credit Suisse (NYSE: CS ), Goldman Sachs (NYSE: GS ) and others have or are planning to exit the commodity trading business? Maybe, but it is more likely that a reduced number of Q-World commodity traders has facilitated the decline. In years past, large market declines were typically met by sell side traders bundling distressed assets into packages of securitized products that were ultimately on sold to buy side investors. The banks once had a stabilizing influence upon volatile markets. Such activity is no longer profitable for the banks due to stringent capital requirements and some outright prohibitions against warehousing the risk. Unwittingly or not, the world’s central banks, led, of course, by the U.S. Federal Reserve, have supplanted the diminished role of Q-World traders by providing an ample dose of extraordinary monetary accommodation. In other words, secular volatility is set to rise and will be further exacerbated once the world’s central banks move to the side-lines. Few people, including myself, expect the days of hyper activist central banking to end anytime soon. Nonetheless, at the margin, even the U.S. Federal Reserve is a little less active then last year. So what are the implications? Secular volatility will rise in most assets classes, particularly those that trade over the counter e.g. government and corporate bonds Market corrections will be more violent, happen quicker and take longer to reverse than in years past Intrinsic value does not change, although cash flow value may- which will ultimately lead to an abundance of market opportunities Specifically, there are now opportunities to buy the SPDR S&P Oil & Gas Explore & Production ETF (NYSEARCA: XOP ) after it fell 30% in 2014. The PowerShares DB Com Index Tracking ETF (NYSEARCA: DBC ), also off close to 30% in 2014, offers investors greater exposure to a basket of commodities, although the ETF maintains significant exposure to oil. Timing such purchases is always difficult, and the risk of being too early is real. My point here is that such declines have as much to do Q- World inactivity as they do with fundamental changes to the supply demand equilibrium. Hence, a good portion of the recent drop should prove to be transitory. Investment success rests with those that can best understand the phenomenon of markets explained by basic economic mechanisms such as supply and demand and, which can also incorporate agent based models of behavior. There is little doubt that such agent based models such as the need to save for retirement, risk aversion or the savings and consumption patterns of millennials to name just a few, account for a large portion of the variance of asset returns. What has changed recently is the agent based conduct of the Q-World traders rather than any fundamental principle of economics. That leads to opportunities for P-World investors like you and me. The trick is to balance your assessment of both Type I errors – investing in an unprofitable strategy and Type II errors – missing a truly profitable trading opportunity. The likelihood of making a Type II error has increased simply because there are fewer Q-World traders willing and able to take the other side of market overreactions such as the mid October 2014 equity selloff, materially wider U.S. High Yield spreads and the ever lower Euro currency. Looking ahead to 2015, I think it is important to note just how important it is to get your interest rate call right. Last year, Utilities (SPDR ETF, XLU ), REITs (iShares Dow Jones US Real Estate ETF, IYR ), and high-quality, long-duration government bonds (iShares Barclays 20+ Yr Treasury Bond ETF, TLT ) had total returns close to 25% to 30%. These three asset classes benefited enormously from lower nominal and real U.S. interest rates. With interest rates in play again in 2015 (higher or lower), the difference between Q and P world pricing and valuation becomes even more important. It used to be that investors just had to get the growth and inflation call right, and the interest rate view would simply follow. That no longer seems to be the case. It’s a big deal, and it’s a theme that I plan to develop further in a future newsletter. Look at it this way. U.S. growth and inflation readings in 2015 are likely to be quiet supportive of risky assets. Yet the market’s attention is almost wholly captured by a potential rise, however modest, of the Federal Funds rate.