Tag Archives: nysearcabxub

How Diversifying Can Help You Manage Market Mayhem

Summary Diversification is not simply about holding more assets. It is about paying attention to how the different parts of your portfolio work together. At its most basic, you have three components: stocks, bonds and cash. You may want to hold a blend of all three, depending on your goals. Four traits adding flavor to a balanced portfolio include quality, geography, sectors and styles and size. The recent market volatility, while not unexpected , has certainly been hard for any investor to digest. If you are feeling a tad queasy, you aren’t alone. It’s an apt moment to pause and remind ourselves of the importance of diversification to help your portfolio ride through market turmoil. What is Proper Diversification? While attempting to teach my youngest daughter about nutrition over the summer, I pulled up the nutrition wheel . As I showed her the various food groups, I was reminded of a diversified portfolio with all its asset classes. Arguably the most overused word in investment jargon, diversification is not simply about holding more assets. It is about paying attention to how the different parts of your portfolio work together. It’s part art and part science, like so many things in life, and takes some careful thought to make the right choices. Think of it like maintaining a balanced diet – one food isn’t going to give you all the nutrition you need. Asset Classes as Food Asset classes are your basic food groups – carbs, proteins and vegetables. As with food, each asset plays a different role. At its most basic, you have three components: stocks, bonds and cash. Stocks are generally riskier than bonds, but you can potentially see greater gains over time. When stocks decline, bonds have generally held up better and often delivered positive returns. And then there’s cash, which many investors use to preserve capital for a major expense, like college tuition. You may want to hold a blend of all three, depending on your goals. Simply a mix of individual company stocks and corporate and government bonds, however, may not give you everything you need to best manage risk and return. A balanced portfolio could also include a variety of nutrients and flavors. Four Traits of a Balanced Portfolio Quality For your bond portfolio, you’ll want to consider diversifying across credit quality – such as Treasuries, investment-grade and high yield – each of which has a unique risk/return profile. For stocks, you may want to focus on the quality of a company’s balance sheets and evaluate factors such as dividend growth, earnings or management. Geography It’s natural to have a home-country bias, and the U.S. is still one of the strongest markets in the world. But there’s no denying that we live in a global economy. There can be real benefits to expanding your geographic horizon to pursue opportunities in other regions and countries. Try to have a risk-balanced blend of investments across developed and emerging markets so you’re well positioned globally. Also, keep in mind that the value of the dollar against other currencies has become more important to your bottom line lately. So consider whether some currency-hedged exchange traded funds (ETFs) may help to protect your portfolio against sudden changes. Sectors And Styles Industries respond differently to different parts of the business cycle. For example, cyclical sectors, such as technology and discretionary consumer goods, generally benefit from economic upturns. On the other end, defensive sectors, such as food staples and utilities, are the last areas that people cut back on when times are tough. There are also certain styles of stocks to consider, such as value or momentum, and, for certain investors, some smart beta strategies may be an alternative to consider to help you access those styles. In short, cycles turn, so you probably want to make sure you’re not over-concentrated in one area. Size Everyone wishes they had invested in just the right tech company in the early 1980s, when the now-successful ones were just getting off the ground. But back then, who knew that personal computers would not only be in nearly every home like a TV, but might actually kick TVs to the curb? While it’s true that smaller companies can sometimes pay off big, they also carry higher risks. So you’ll want to consider a mix of small, medium and large companies. Many investors skew to the large side, unless you have the stomach for lots of ups and downs. Stay Diversified Until the End This may feel like a lot to manage, but it’s not as complicated as it seems. Many online resources and financial planners can break down your existing portfolio into a pie chart so you can see what slices you have. Then seek advice before making any changes. If you’re just getting started, internet tools can help you create a diversified core portfolio . Or consider a core allocation ETF , based upon your risk appetite and time horizon. As you approach your goals, you may need to reallocate your holdings. But that doesn’t mean that you should be less diversified. Make sure you always have an appropriately balanced diet of investments. This post originally appeared on the BlackRock Blog.
Is A Recession Necessary For The S&P 500 To Fall 20% From All-Time Highs?

Is it possible for a bear market to occur when the U.S. economy is expanding? Certainly. In spite of the obvious evidence that U.S. stock assets tend to fall long before the most prominent minds affirm contraction in the U.S. economy, an overwhelming number of analysts keep exclaiming that there is no recession in sight. Right now, U.S. stocks require clarity on rate policy more than they require anything else. Is it possible for a bear market to occur when the U.S. economy is expanding? Certainly. In fact, most bear markets are already well on their way to becoming 20% price declines long before a recession is formerly identified. Consider the most recent bearish retreat (10/07-3/09). The National Bureau of Economic Research (NBER) officially declared on 12/1/08 that the U.S. recession had started in December of 2007 – a declaration that came nearly one year after the economic downturn’s inception. Nine months before the NBER expressed its “recession” call, the S&P 500 had already plummeted close to the 20% level (March 2008.) At that moment, the Federal Reserve saved financial markets by joining JPMorgan Chase in bailing out Bear Stearns. Then, in the first week of July, five months before the NBER proclamation, the S&P 500 had descended more than the requisite 20%. And by the time anyone could count on an authenticated recession, the S&P 500 had already plummeted roughly 47.8% – close to half of its entire value. Well, okay. I suppose that the world’s best economists should err on the side of caution before making hasty decisions. Perhaps NBER, composed of academic economists from Harvard, Stanford and other top-notch universities, were quicker in warning investors prior to the 3/2000-10/2002 tech wreck? Unfortunately, nine months before the NBER expressed a March 2001 recession start in November of 2001, the S&P 500 had already made its bearish descent. (Nine months again?) It gets worse. The S&P 500 had already dropped 29% by November of 2001 and the “New Economy” NASDAQ had already plummeted 65%! In spite of the obvious evidence that U.S. stock assets tend to fall long before the most prominent minds affirm contraction in the U.S. economy, an overwhelming number of analysts keep exclaiming that there is no recession in sight. And without a recession, they say, there’s not going to be a bear. I am not sure this is an accurate statement. Since 1950, we have seen non-recession 20%-plus drops in 1962, 1966, 1978 and 1987. We have also seen non-recession drops that do not get the full benefit of the bear title (e.g., 1998’s Asian currency crisis/Long-Term Capital Management, 2011’s eurozone, etc.), yet reached the 20% threshold via “intra-day” price movement and/or “rounding.” What’s more, why do people automatically assign the recession tag to bear markets like the 3/2000-10/2002 tech wreck when the recession first began one year later in March of 2001? Perhaps because NBER later revised the recession date as having started in Q4 2000? I have no idea if we will see a bear on this correction go-around or the next 10%-19% pullback or the one after that. What I do know is that the commodity slump has resulted in ConocoPhillips (NYSE: COP ) slashing 10% of its global workforce; high paying oil jobs continue to disappear in a world of $45 oil. I also know that the Federal Reserve wants to hike overnight rates, likely raising the borrowing costs for consumers and businesses just as the Atlanta Fed expects Q3 GDP at an anemic 1.2%. Perhaps most importantly, I recognize that the U.S. economy is part of a global economy that has been decelerating. JPMorgan’s Global Manufacturing PMI is now at 50.7 where a reading below 50 would be indicative of a global manufacturing recession. In mid-August’s ” 15 Warning Signs ,” I discussed the reasons why a pullback from the market top was exceptionally likely. One week later, in ” Don’t Blame China, ” I talked about the reasons why investors should expect a relief rally. And in my Thursday (8/27) commentary, ” Are You Selling The Drama Or Buying The Rally ,” I wrote: If history teaches us that benchmarks tend to retrace half of their losses before retesting their lows – if you feel like you’ve been here before and you don’t choose to be scarred like that again – perhaps you might anticipate better buying opportunities in the weeks ahead. You should not be surprised by today’s (Tuesday, September 1) extremely volatile move lower. The S&P 500 has moved back below the correction point of 1917 because the global economy is decelerating and investors are fearful that a rate hiking campaign by the Federal Reserve might be the straw that breaks the U.S. camel’s spine. And manufacturer-dependent sector funds like Materials Select Sector SPDR (NYSEARCA: XLB ) are taking the heaviest hits. Do I think that a Fed tightening cycle might cause an imminent U.S. recession? Not if chairwoman Yellen and other committee members decide upon a sloth-like pace of one-eighth of a point every third meeting or a “one-n-done” quarter point that would not be revisited for six months. Then again, I am not sure that the recession/non-recession matters as much as others do. Right now, U.S. stocks require clarity on rate policy more than they require anything else. The longer it takes for the Fed to provide clarity, the more U.S. stocks are likely to struggle. Disclosure: Gary Gordon, MS, CFP is the president of Pacific Park Financial, Inc., a Registered Investment Adviser with the SEC. Gary Gordon, Pacific Park Financial, Inc, and/or its clients may hold positions in the ETFs, mutual funds, and/or any investment asset mentioned above. The commentary does not constitute individualized investment advice. The opinions offered herein are not personalized recommendations to buy, sell or hold securities. At times, issuers of exchange-traded products compensate Pacific Park Financial, Inc. or its subsidiaries for advertising at the ETF Expert web site. ETF Expert content is created independently of any advertising relationships.

Does The Presidential Cycle Have A Significant Impact On Stock Market Performance?

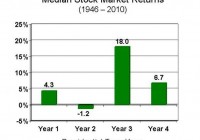
Summary The third year of a presidential cycle has historically offered outsized returns. In this study, data for 1928 to 2014 were analyzed to evaluate the effect of the presidential cycle on S&P 500 performance. Given that we are currently in Obama’s third year (of his second term), should we be expecting significant gains ahead? Introduction In a previous article entitled ” The January Effect Revisited And A Call For The Use Of Elementary Statistics “, I made the case that assertions of outperformance should be supported by elementary statistics. In the case of the January effect, I analyzed monthly data from 1988 to 2014 to show that the standard deviation of monthly returns was actually very large compared to the average return for any given month, rendering most of the observed seasonal deviations to be statistically insignificant. Yet, the absence of error bars on the most popular graphs illustrating the January effect means that investors studying the chart would be unable to ascertain whether [i] the outperformance is statistically significant and [ii] whether or not the increased return is worth the risk. The article ended with an exhortation for all analysts to incorporate simple statistical analysis into their charts. In the present article, we analyze another phenomenon that may be playing out at the present time: the impact of the presidential cycle (also known as the election cycle) on stock market performance. The following charts are top hits in a Google search for “presidential cycle stock market”. (Source: GoBankingRates ) (Source: Murray Financial Group ) (Source: Seeking Alpha ) (Source: John Rothe ) All four charts show the 3rd year of a president’s term to be the best in terms of stock market performance, and the 2nd year to be the worst. Interestingly, the last chart seems to show that the final quarter of the 2nd year actually delivers the best performance out of all 16 quarters in the presidential cycle. Now, what are all four charts missing? If you had read the previous article (or the introduction) you would know that the answer is “error bars”. Given that we are currently in the 3rd, and presumably “best”, year of Obama’s presidency (the second term), I was interested to determine whether or not the presidential cycle has a statistically significant impact on stock market performance. Results and discussion Yearly total return performance for S&P 500 (NYSEARCA: SPY ) from 1928 to 2014 was obtained from Aswath Damodaran . For the purposes of this study, the four-year presidential cycle is assumed to occur continuously even though there have been interruptions with certain presidents. For example, Gerald Ford’s first year in the office in 1974 would still be counted as the second year of the presidential cycle (since it would have been Richard Nixon’s 6th year in office). The S&P 500 annual total return distribution from 1928 to 2014 shows a bell-like shaped curve with a negative skew, from which the dreaded “left tail” can be observed. Yet, it should be noted that 63 out of the 87 years (or 72.4%) in this study have had positive returns. The average return over the 87 years was 11.53%, while the median return was 14.22%. This is one reason why “buy-and-hold” has worked so well for the average investor in the U.S. market. First let’s have a look at the average performance of the stock market over the four-year presidential cycle. (click to enlarge) Consistent with the charts presented in the introduction, we find that the 3rd year of the presidential cycle provides the greatest performance, with an average performance of 17.57% (and median of 22.34%). Moreover, the 3rd year was the only year that outperformed the average overall return of 11.53% (and median of 14.22%). The other three years all underperformed the average, with the 2nd year having the lowest return of 8.80% (and median of 10.00%), again consistent with previous charts. The next chart shows the data for average returns but with the inclusion of error bars representing the standard deviation of the results. (click to enlarge) We see that the standard deviation of the annual returns is larger than the actual returns (though not overwhelmingly so), indicating significant variability in the results. One way to visualize these error bars is to assume that about 68% (or just over two-thirds) of the data points lie between the error bars. A t-test was conducted to investigate whether or not the annual returns of each year of the presidential cycle is significantly different from the overall average return of 11.53%. The results are shown in the table below.   1st 2nd 3rd 4th Mean 8.99% 8.80% 17.57% 11.03% Standard deviation 22.01% 21.21% 18.90% 17.20% p-value 0.594 0.553 0.158 0.893 Significant? No No No No The results of the t-test show that none of the years of the presidential cycle are significantly different from the average year. A number of commenters in the previous article mentioned that because the return distribution is not exactly normal (there is some skewness or kurtosis), an alternative test such as the Wilcoxon test should be performed. Therefore, I also calculated the p-value using the one-sample Wilcoxon signed-rank test to determine whether the median returns for each year of the presidential cycle was significantly different from the overall median return of 14.22%.   1st 2nd 3rd 4th Median 7.40% 10.00% 22.34% 13.35% p-value p> 0.10 p> 0.10 p> 0.10 p> 0.10 Significant? No No No No Similarly, the one-sample Wilcoxon signed-ranked test shows that none of the observed performances were significant. (It is noted that the Wilcoxon test assumes a symmetrical distribution, which is not perfectly valid for the present distribution. I considered the one-sample sign test, but that test does not capture the magnitude of differences from the median. If anyone knows another simple one-sample, non-normal, non-symmetric test that can be used instead, please let me and the readers know!) C onclusion While the 3rd year of a presidential term has delivered, on average, outsized returns for the past 87 years (from 1928 to 2014), any deviations between any of the years of the presidential cycle and the average or median return were found to be insignificant. Note that statistical tests such as these do not “disprove” the presidential cycle effect, nor do they prevent you from profiting (or attempting to profit) from the perceived opportunity. What the tests do tell you is that for the past 87 years, any impact that the presidential cycle has had on stock market returns is indistinguishable from chance. Therefore, this article ends with another call for analysts to incorporate simple statistical analysis into their presentations. This information would allow investors to evaluate [i] whether the outperformance is statistically significant and [ii] whether or not the increased return is worth the risk. Author’s note: On a personal level, I was rather disappointed in the outcome of this study. Given that we are currently in the 3rd year of the presidential cycle, I was really hoping that the effect would be significant. I guess that’s confirmation bias creeping in!