Tag Archives: nysearcabnd

Update On American Express And Investing Tips

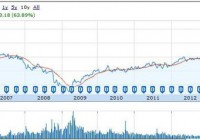
American Express is down $10 a share from our entry price. Nevertheless we are staying the course and holding this stock long term. We will not be shorting stocks in our 1% portfolio. There are many more “long” millionaires than “short.” Our new position, BND, is performing well. It will be a good anchor for our portfolio as its volatility seems to be very low. So finally the ECB has decided to resort to quantitative easing like the U.S. It actually is going to spend 60 billion euros a month instead of the 50 billion figure leaked yesterday. Will it work? Has quantitative easing worked in the U.S.? The bulls would say yes with 5% GDP and low unemployment. The bears would say no with trillions of extra debt and an upcoming dollar crisis. I’m with the bears on this one. All throughout history printing money has always lead to inflation and a weak currency. Would you prefer to live in Switzerland where the Swiss central bank has decided to stop printing money (finally) or Spain where the ECB is going to print 720 billion euro this year alone? The “unintended consequences” will soon start to emerge as all fiat currencies will begin to lose substantial purchasing power. At this inflection point, the public will rush into hard assets such as Gold and Silver. Our portfolio is doing well with now close to $400k invested. I want to touch on American Express Company (NYSE: AXP ) as a follower asked me about its validity going forward. We bought the stock at $94 and currently the stock is trading at around $84 a share. Also the portfolio received a dividend payment of $69 last week. The stock is selling off today due to earnings that were announced in the last 24 hours. Furthermore the company announced recently that it is cutting at least 4000 jobs. Irrespective of the negativity surrounding American Express lately, we are not selling our position. Yes the dividend yield is low at 1.2% but the company has committed to increased dividends and subsequently has increased its dividend for the last three years. However there are many more reasons to hold this stock long term. First of all it dominates its industry and when a company has this much market share, it recovers from recessions quicker than other companies ( see its recovery in the chart below since 2008). The company is still well-priced at these levels and its market cap just continues to grow over time. Have the courage to hold it. In the long term it will do very well. We as fundamental investors who will continue to collect dividends and option premium and wait for the stock price to recover. (click to enlarge) The follower is fearful the stock may drop ( and it may do – in the short term). As investors we need to invest with the end goal in mind. We can’t be taken off course just because of sharp movements in our underlyings. We stay the course and we stick to our plan. Fear also exists on the way up. One such example is the gold market. Long term gold investors are long and will stay long for the long haul. Gold is up 10% already this year. Do these long investors sell and take their profits? No way. These gold bulls are in it for the long haul and that’s how the big profits are made. In one way, holding physical gold is better than holding an ETF or stock. You can’t sell your asset as easily as you can sell an ETF that tracks the Gold price like the SPDR Gold Trust ETF (NYSEARCA: GLD ). Here lack of liquidity is an advantage. Therefore If you believe in your investment, have the courage to hold it through thick and thin. Be prepared to “ride the bull” as that’s where the big profits are in a healthy bull market. Shorting stocks or ETFs also wont happen in this portfolio. There are many distinct disadvantages when shorting underlyings in your portfolio. You are borrowing shares from your broker. You do not have 100% control and sometimes your broker will “call away” your shares at very short notice because the lender wants his stock back. This happens especially when many investors are shorting the same stock. Losses can be infinite (multiple times your initial trade). You need a margin account to short so you pay monthly interest on your bet. Finally I mentioned the other day that the portfolio bought the Vanguard Total Bond Market ETF (NYSEARCA: BND ). I must say that I like its action. Its going to be a good anchor for this portfolio (at least in the short term until the bond trend changes). This ETF tracks 3000 U.S. bonds (all types) and has a 2% annual yield. What’s interesting today is that the iShares 20+ Year Treasury Bond ETF (NYSEARCA: TLT ) and the iShares 7-10 Year Treasury Bond ETF (NYSEARCA: IEF ) are down but our ETF is unchanged. I believe this is the best place to be in the bond sector but we will be watching closely for a trend change and at that point we will put more capital to work in this sector. Automatic profits were taken on positions in McDonald’s Corporation (NYSE: MCD ) and IBM (NYSE: IBM ) this week and new positions were opened (see the screen shot below). (click to enlarge) Current Balances – Making Progress – Slow & Steady wins the race. Now that you’ve read this, are you Bullish or Bearish on ? Bullish Bearish Sentiment on ( ) Thanks for sharing your thoughts. Why are you ? Submit & View Results Skip to results » Share this article with a colleague
Ivy Portfolio Year End Update

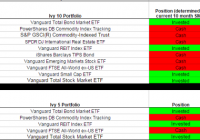
Scott’s Investments provides a daily Ivy Portfolio spreadsheet to track the 10-month moving average signals for two portfolios listed in Mebane Faber’s book The Ivy Portfolio : How to Invest Like the Top Endowments and Avoid Bear Markets. Faber discusses 5, 10, and 20 security portfolios that have trading signals based on long-term moving averages. I have replaced the Google Docs Ivy and Commission Free portfolio with a new spreadsheet. Please update any bookmarks or links to the newest spreadsheets found here . The Ivy Portfolio spreadsheet tracks the 5 and 10 ETF Portfolios listed in Faber’s book. When a security is trading below its 10-month simple moving average, the position is listed as “Cash.” When the security is trading above its 10-month simple moving average the position is listed as “Invested.” The spreadsheet’s signals update once daily (typically in the late evening) using dividend/split adjusted closing price from Yahoo Finance. The 10-month simple moving average is based on the most recent 10 months including the current month’s most recent daily closing price. Even though the signals update daily, it is not an endorsement to check signals daily or trade based on daily updates. It simply gives the spreadsheet more versatility for users to check at his or her leisure. The page also displays the percentage each ETF within the Ivy 10 and Ivy 5 Portfolio is above or below the current 10-month simple moving average, using both adjusted and unadjusted data. If an ETF has paid a dividend or split within the past 10 months, then when comparing the adjusted/unadjusted data you will see differences in the percent an ETF is above/below the 10-month SMA. This could also potentially impact whether an ETF is above or below its 10-month SMA. Regardless of whether you prefer the adjusted or unadjusted data, it is important to remain consistent in your approach. My preference is to use adjusted data when evaluating signals. The current signals based on December’s adjusted closing prices are below. The spreadsheet also provides quarterly, half year, and yearly return data courtesy of Finviz . However, this data is not currently importing properly so is not included in the screenshot below: (click to enlarge) I also provide a “Commission-Free” Ivy Portfolio spreadsheet as an added bonus. This document tracks the 10-month moving averages for four different portfolios designed for TD Ameritrade, Fidelity, Charles Schwab, and Vanguard commission-free ETF offers. Not all ETFs in each portfolio are commission free, as each broker limits the selection of commission-free ETFs and viable ETFs may not exist in each asset class. Other restrictions and limitations may apply depending on each broker. Below are the 10-month moving average signals (using adjusted price data) for the commission-free portfolios: (click to enlarge) (click to enlarge) Many of you have asked for return data of the Ivy strategy. Below is data for a 10-month moving average system using the Ivy 10 and Ivy 5 portfolio tracked on my site. The test was conducted using ETFReplay.com, so while signals should match mine the returns listed below are strictly hypothetical. The backtest will invest in the chosen ETFs on the close of the LAST DAY of the period. The test was run 2010-2014 and returns have been underwhelming compared to a traditional balanced mutual fund: Ivy 10 (click to enlarge) Ivy 5 (click to enlarge) Disclosure: None

Stock Picking, Intricate As Love

The combination from creating a 20 stock portfolio is a number beyond this earth. A simpler indexing approach provides several benefits like low unsystematic risk and low cost. You can still be active and pursue a source of alpha while also retaining the benefits of index investing. In ABC’s ‘The Bachelor’, the road to love involves weeks of flirting, romance, cat fights, twist and turns, where one guy is introduced to 25 lovely girls. Picking 1 out of 25 girls must be a lot of work. Likewise, researching stocks is a lot of work and arguably not as fun as dating. But you have many choices. The S&P 500, often used as a proxy for the total US stock market, offers 500 choices. If one were trying to create a 20 stock portfolio, how much work would be appropriate and what are the possibilities? Instead of trying to quantify the workload necessary, an especially subjective matter, let’s gauge the implications of the variables involved in picking stocks by looking at all the resulting combinations that are possible. For our group of stocks, let’s take the S&P500, consisting of 500 individual stocks. To take out capitalization weighting effects, we will actually use the S&P 500 equal weighted index, which includes the same constituents as the capitalization weighted S&P 500. Picking a certain number of stocks out of 500 is a simple calculation using binomial coefficients, mathematics used since the 10th century in India. Binomial coefficients are a family of positive integers that occur as coefficients in the binomial theorem. The coefficients that appear in the expansion are usually written as: This method is applicable because selecting stocks from a group is essentially picking k objects from a population of n distinct objects without replacement and without regard to order. If we select 20 stocks for our portfolio, there are 266719851283743829654740530950952475 combinations of selecting 20 stocks out of a group of 500, calculated from simply applying binomial coefficients: To grasp the magnitude of this amount, if each combination was the height of a flat dollar bill, the stack of dollar bills would scale up from the earth to the sun about 195 quintillion times. (quintillion is a billion billions). Likewise, the stack of dollar bills would go from our Sun to its nearest star, Proxima Centauri 726 trillion times. Comparatively, if the Voyager 1 spacecraft (speed=38000mph) were to go to Proxima Centauri, it would take over 73 thousand years to arrive. The many different possible portfolios are staggering, even when limiting selection only within the S&P500. With so many, inevitably one combination, picked arbitrarily at random could beat a combination created by a professional. This sheds light on the often heard claim that a monkey can out-pick a mutual fund manager. But nobody should pick stocks, bonds, or other securities at random. You wouldn’t pick your next boyfriend, girlfriend, potential spouse at random. You would expect a better outcome if you are discerning in your selection. Accordingly, thousands of discerning mutual fund managers seek superior performance and some actually achieve it. Of course, magazines like Forbes report time and again that the majority of professional can’t beat the index. However, the Wall Street Journal ran an expert vs. random dart throwing simulation for 14 years, but declared no clear winner. No clear winner will ever be discovered in this holy war, because of the staggering number of possibilities. One way to simplify investing is to invest in the index. Indexing provides several benefits like low cost and low unsystematic risk, even lower than a 20 stock portfolio. You do not have to be entirely passive. Instead of being active in the securities selection layer, another approach is to be active at asset allocation layer, using index investing. (click to enlarge) When constructing your portfolio, consider where you should put most of your effort. One approach employed by many professionals focuses on a top-down investment strategy attempting to exploit opportunities among a set of assets, positioning a portfolio into assets or sectors that show the most potential for gains. The strategy focuses on the relative performance of asset classes rather than on the performance of individual securities. With more focus on the asset allocation layer, one can still seek a source of alpha while also retaining the benefits of index investing. Further, the derivative securities used to actively asset allocate are highly liquid and low cost to transact for example, (NYSEARCA: SPY ),(NYSEARCA: EFA ),(NYSEARCA: BND ). Additional disclosure: Article is for educational purposes only and does not constitute financial advice.