Tag Archives: nreum

Lipper Closed-End Fund Summary: July 2015

By Tom Roseen While for the third consecutive month equity CEFs suffered negative NAV-based returns (-0.72% on average for July) and market-based returns (-1.96%), for the first month in three fixed income CEFs were able to claw their way into positive territory, returning 0.45% on a NAV basis and 0.82% on a market basis While the NASDAQ Composite managed to break into record territory in mid-July after a strong tech rally following Google’s surprising second quarter result, as in June advances to new highs were generally just at the margin. Despite signs of improvement in Greece’s debt crisis and on China’s stock market meltdown, investors turned their attention to second quarter earnings reports and began to evaluate the possible impacts slowing growth from China and the global economy will have on market valuations. The markets remained fairly volatile during July. At the beginning of the month rate-hike worries declined slightly after an inline jobs report and soft wage growth were thought to give policy makers an excuse to postpone rate hikes until December. The Labor Department reported that the U.S. economy had added 233,000 jobs for June. And while the unemployment rate declined to 5.3%, most of it was due to people leaving the labor force. With the Chinese market taking back some of its losses and the Greek debt saga appearing to be closer to a resolution, European stocks rallied mid-month. However, later in the month disappointing earnings results from the likes of Apple (NASDAQ: AAPL ), Caterpillar (NYSE: CAT ), and Exxon (NYSE: XOM ) and commodities’ continuing their freefall placed a pall over the markets. Concerns over slowing global growth and the Shanghai Composite’s recent meltdown weighed on emerging markets, sending Lipper’s world equity CEFs macro-group (-1.52%) to the bottom of the equity CEFs universe for the month. While plummeting commodity prices weren’t much kinder to domestic equity funds (-0.80%), investors’ search for yield helped catapult mixed-asset CEFs (+0.77%) to the top of the charts for July. With China suffering its worst monthly market decline in six years, crude oil prices closing at a four-month low, and gold futures posting their worst monthly performance in two years, investors experienced bouts of panic and sought safe-haven plays intermittently throughout the month. At maturities greater than two years Treasury yields declined, with the ten-year yield declining 15 bps to 2.20% by month-end. For the first month in four all of Lipper’s municipal bond CEFs classifications (+1.10%) witnessed plus-side returns for July. However, domestic taxable bond CEFs (-0.13%) and world bond CEFs (-0.98%) were pulled down by investors’ risk-off mentality. For July the median discount of all CEFs narrowed 2 bps to 10.50%-worse than the 12-month moving average discount (9.13%). Equity CEFs’ median discount widened 41 bps to 11.15%, while fixed income CEFs’ median discount narrowed 58 bps to 9.86%. For the month 46% of all funds’ discounts or premiums improved, while 51% worsened. To read the complete Month in Closed-End Funds: July 2015 Fund Market Insight Report, which includes the month’s closed-end fund corporate events, please click here .
Do Your Alternative Investments Have The Right Fit?

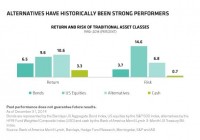
By Richard Brink, Christine Johnson Investors who chose alternatives for downside protection in recent years have been frustrated with their performance. We think the problems were an unfavorable market environment and the unique challenges of manager selection for alternatives. In May 2013, the market’s “taper tantrum” in reaction to announced changes in U.S. monetary policy pushed bond yields up; stocks stumbled briefly before continuing to pile up strong returns. For many investors, this heightened concerns about extended market valuations and an impending interest-rate increase. Taking a page from the typical playbook, many investors looked toward long/short equity strategies and nontraditional bonds as ways to protect against potential market downside. But in 2014, playing defense didn’t pay off: U.S. equity markets gained another 14% and bond yields fell. Long/short equity strategies, on average, returned 4%. That experience left many investors disappointed with alternatives-both equity-oriented and fixed income-oriented. It hardly came as a surprise when investors shifted money out of alternatives early in 2015, moving it into core fixed-income funds and international equities-mostly through passive exchange-traded funds (ETFs). The Long-Term Value of Alternatives We think investors were right in looking to alternatives for protection against potential downturns. Alternatives have provided better returns than stocks, bonds or cash over the past 25 or so years, with less than half the volatility of stocks ( Display ). And long-term data show that incorporating alternatives in a traditional portfolio may enhance returns and reduce risk. If that’s the case, what went wrong in 2014? We think the problem was twofold. First, a good portion of alternatives’ poor performance stemmed from the multiyear, largely uninterrupted bull-market run. This extended rally rendered the long-term benefit of “hedging” with alternatives somewhat moot. Second, many investors bought the right idea of alternatives: participation in all markets with downside protection. But in many cases, they didn’t buy the specific behavior in an alternative that was the best fit for their portfolio and risk/return preferences. It’s not an easy selection process. There are thousands of different alternative strategies to choose from and a lot of dispersion among managers within alternative categories. It’s not enough to simply buy a top performer from a seemingly relevant category. It’s critical to have specific characteristics in mind: Exactly how much downside protection do you want? And how much participation in up markets are you looking for? Once you know your objectives, you can start doing the homework to zero in on a strategy and manager that aligns with them. What’s in an Alternative Category? Everything One of the challenges to finding the right fit is that alternative categories have a lot more variety than their traditional equivalents. They just don’t provide as much help in narrowing down the decision. Take Morningstar indices. They have about 40 different categories for traditional, or long-only, equities. There are categories for different geographies, market capitalization ranges, styles and even sectors. For long/short equities, there’s only one category. If an investor wants to find the right long/short equity strategy, it takes a lot of legwork to uncover the one with the best fit. Without that, investors are at the mercy of manager dispersion. Three Levers That Create Manager Dispersion What creates such big dispersion among alternative managers? We think three levers are at play: style, market risk and approach. We talked about the first lever already: the traditional style buckets of geography, investment approach, market capitalization and industry/sector make for a lot of differences. The second lever is how much overall market risk and sensitivity a manager has-a lot or a little-and how much it varies depending on conditions. The third lever is the approach a manager uses to create the portfolio’s overall market exposure. For example, does the manager use cash, market hedges or short positions in individual stocks? What mix of these instruments does the manager use, and in what environments? All three elements and their combinations can vary to define your experience with a specific alternative manager’s approach. Conducting three-dimensional research to gain a clear understanding of the levers-and which settings are best for you-is the key to choosing the right alternative manager. And the need to make that choice is rather pressing today, in our view. There aren’t a lot of broad cheap areas in capital markets today, and we expect more modest returns and higher volatility ahead for both stocks and bonds. Relying on broad market returns alone isn’t likely to be as rewarding in the years to come, and alternatives can play a key role in enhancing a portfolio’s risk/return profile. The views expressed herein do not constitute research, investment advice or trade recommendations and do not necessarily represent the views of all AB portfolio-management teams.

Normal Doesn’t Exist

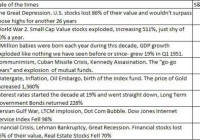
By Andy Hyer Michael Batnick on “waiting for normal:” These are not normal times investors are living in. The Fed has held short-term interest rates at zero for six years now, a policy experiment never seen before. This has many investors eager to see what happens if and when this returns to “normal.” One of the biggest psychological challenges of investing is that there is always something out of the norm. Take a look at the table below which highlights different times investors had to live through and the extreme performances that accompanied them. I wonder at what point would somebody would have described the times as normal. Next, have a look at the chart below, which shows the S&P 500 return by decade. You’ll notice absolutely no pattern. Understanding how different it always is should be a great reminder why no strategy will work in all market environments. Knowing the limitations to what you are doing- whatever you’re doing- is critical. The ability to stick with your plan during the bad times will determine if you’ll be around for the good ones. So what is an investor to do? I see a couple options: Employ some form of static asset allocation and hope for the best. 25% fixed income, 25% US equity, 25% international equity, and 25% alternatives, and rebalance annually. Employ some type of forecasting to try to be opportunistic in asset class exposure Employ some form of trend-following tactical approach to asset allocation The static allocation approach may ultimately perform okay over long periods of time, but will investors have the risk tolerance to continue with long stretches of an asset class being out of favor / going through severe drawdowns? Maybe. Maybe not. Chances are the forecasting approach will end very badly, as forecasting usually does. The third option makes much more sense to me. Simply systematically deal with trends as they unfold. This is the approach we use with our Global Macro separately managed account, which happens to be our most popular SMA strategy. Thank goodness we gave ourselves as much flexibility as we did with the way that this portfolio is constructed, because this decade has been entirely different from the last one. As one example, consider how well commodities performed in the last decade, compared to the trainwreck that they have been so far this decade. Normal doesn’t exist. A disciplined way to be flexible is the key to successfully navigating the ever-changing financial landscape. The relative strength strategy is NOT a guarantee. There may be times where all investments and strategies are unfavorable and depreciate in value. Share this article with a colleague