The Risk Of Owning Stock Assets And Holding Stock Assets Right Now
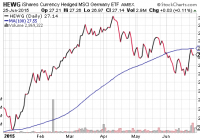
Hold-n-hope advocates believe that greater gains with stocks over investment grade bonds require nothing more than a commitment to accepting increased volatility. At least during the bulk of the current century, one’s willingness to endure wacky stock price changes did not lead to enhanced results. Risk is not synonymous with price volatility, even though erratic price shifts do lead to a greater likelihood of losing money. Hold-n-hope advocates believe that greater gains with stocks over investment grade bonds require nothing more than a commitment to accepting increased volatility. In other words, if you accept the occasional craziness of stock prices, then your rewards will be far more robust than lower yielding debt instruments. But is that even accurate? In the 15-year period through 5/31/2015, stocks exhibited 4 times the amount of price vacillation (a.k.a. volatility) than bonds. Yet the S&P 500 SPDR Trust ETF (NYSEARCA: SPY ) provided annualized gains of 4.5% and the iShares Core Total U.S. Bond Market ETF (NYSEARCA: AGG ) produced annualized returns of 5.4% in the same time frame. At least during the bulk of the current century, one’s willingness to endure wacky stock price changes did not lead to enhanced results. The facts become even more revealing when one examines them in dollar terms. An investor who placed $250,000 in SPY on 6/1/2000 found the investment growing to $483,000 by 5/31/2015. He did not sleep particularly well during the dot-com bust, financial collapse or the euro-zone crisis, but he made progress with his account. Meanwhile, an investor who placed $250,000 in AGG on 6/1/2000 witnessed her investment growing to $550,000 by 5/31/2015. Her world never felt like it was coming to an end; she slept like a beloved house cat on a warm blanket. Risk represents the possibility of loss. Risk is not synonymous with price volatility, even though erratic price shifts do lead to a greater likelihood of losing money. It follows that many trumpet the idea that if you hold stocks long enough, you cannot lose money, let alone lose out to bond assets. Keep in mind, however, there are circumstances when stocks have struggled to break even over 65 years, 30 years as well as 15 years . Additionally, there are no guarantees that one will achieve a positive inflation-adjusted outcome over any time period. On the contrary. History suggests that when one pays an inordinate amount for the privilege of stock ownership, he/she would be fortunate to be “made whole” over 3, 5, 7 and 10 year periods. By nearly every measure of stock valuation, investors are already paying an inordinate amount for stocks. This alone implies that one might be setting himself/herself up for poor returns over the short- and intermediate-term. Let’s revisit the mistake that scores of investors made in June of 2000. They purchased stocks when price-to-earnings (P/E) and price-to-sales (P/S) ratios were higher than they had ever been beforehand. The result? An exceptionally rocky ride that produced little in the way of gain, and that’s if one had the fortitude to hold through thin and thick. Today, the P/E and P/S ratios for the median U.S. stock are higher than they were in June of 2000. So, then, what’s the probable result for buy-n-holders over the next 3, 5, 7 and 10 years? Even 15 years may be discouraging for those who pay today’s premium for ownership privileges. Granted, today’s 10-year yield is 2.38%. In June of 2000? 5.28%. The likelihood that bonds will outperform stocks over the next 15 years may be pretty darn slim. Over 10 years, however? With less risk of loss? Less volatility? In a buy-n-holder’s world, 2.4% on the 10-year may not be so ugly. My approach to the risks associated with owning and holding stocks at the current moment is to maintain cash/cash equivalents at 15%-20% for most of my client base. How did we move from roughly 70% growth/30% income to roughly 55%-60% growth/20%-25% income and a basket with cash/cash equivalents? Throughout the year, I reduced exposure to intermediate- and longer-term bonds; I had reduced the exposure to stock ETFs as well – stock ETFs like iShares Currency Hedged Germany (NYSEARCA: HEWG ) that had hit stop-limit loss orders and/or fallen below key trendlines. I will keep the 55%-60% growth allocation in funds like the Vanguard High Dividend Yield ETF (NYSEARCA: VYM ), the iShares S&P 100 ETF (NYSEARCA: OEF ) and the Health Care Select Sect SPDR ETF (NYSEARCA: XLV ), until those assets break below long-term moving averages or hit pre-determined stop-limit losses. And when cash is raised, the proceeds will be moved to money markets or shorter-term vehicles like the S PDR Nuveen Barclays Short-Term Municipal Bond ETF (NYSEARCA: SHM ). Why the combination of lower-risk equity positions, lower-risk bond positions and a higher cash allocation? Later or sooner, profitability and revenue shortfalls will weigh on equities. Later or sooner, borrowing cost increases will weigh on bonds and stocks. Most importantly, the best way to deal with sky-high valuations as well as the increased cost of capital is to keep more of the dollars that you already have. Is preservation sexy? No. Might it seem like a silly proposition over the next three months, six months, or one year? Perhaps. Looked at another way, though, selling overvalued assets higher offers one the opportunity to purchase fairly valued or undervalued assets lower. With current prospects for stock percentage returns sitting at 0% for three, five, seven and even 10 years, successful investors will prevail by making acquisitions after the proverbial fall. Disclosure: Gary Gordon, MS, CFP is the president of Pacific Park Financial, Inc., a Registered Investment Adviser with the SEC. Gary Gordon, Pacific Park Financial, Inc, and/or its clients may hold positions in the ETFs, mutual funds, and/or any investment asset mentioned above. The commentary does not constitute individualized investment advice. The opinions offered herein are not personalized recommendations to buy, sell or hold securities. At times, issuers of exchange-traded products compensate Pacific Park Financial, Inc. or its subsidiaries for advertising at the ETF Expert web site. ETF Expert content is created independently of any advertising relationships.