Tag Archives: nreum

How Does VXUP/VXDN’s Corrective Distribution Work?

It’s now clear that the AccuShares Spot CBOE VIX Up Shares ETF (NASDAQ: VXUP )/the AccuShares Spot CBOE VIX Down Class Shares ETF (NASDAQ: VXDN ) naysayers were right – the actual behavior of these funds is nowhere close to Accushares’ claim that ” VXUP and VXDN are the first securities to offer direct “spot” exposure to the CBOE Volatility Index (VIX). ” Accushares has said nothing publicly about the poor behavior of the funds. Their only response has been to move up the “go live” date of their Corrective Distribution process. This is a desperation move. Apparently not understanding what has happened to them they are rushing to use the last weapon at their disposal to fix their horrible tracking error (as high as 18%) relative to the VIX. This move will reduce their tracking problem for less than a day and add yet another complexity to these already complicated and broken funds. Accushares’ Corrective Distribution (CD) is intended to reduce any ongoing differences between VXUP/VXDN’s Net Asset Value (NAV) and its market price. I don’t know what specific scenarios they were targeted with in this process, but I’m guessing they were worried about a slow, progressive creep in the market prices versus the NAV. The CD is triggered if there are 3 consecutive days where the tracking error (difference between NAV and closing price) is 10% or greater. To be a valid closing price the last trade must occur within 30 minutes of market close. When the CD is triggered it doesn’t occur immediately, it’s scheduled to accompany the next monthly Regular Distribution or a Special Distribution if that occurs first. A Special Distribution is triggered by a greater than 75% rise in the VIX compared to the reference VIX value established at the beginning of the monthly cycle. Accushares did not expect frequent CDs to be required; in the prospectus they state: “The Sponsor expects that Corrective Distributions will be infrequent, and may never occur.” It’s likely they will occur on a near monthly basis. When there is a significant gap between the VIX’s value and VIX futures prices (which is most of the time) the VXUP/VXDN tracking error will be large. See this post for a near real time accounting of these errors. With a combined Regular Distribution and Corrective Distribution three things occur: The NAV of the higher valued fund is set to equal the NAV of the lower valued fund. A dividend is issued that compensates the holders of the higher valued fund for the drop in NAV value. The dividend is either in cash or an equal number of VXUP/DN shares with a net value equal to the cash dividend. Accushares issues a new complementary share to every shareholder. If you have VXUP, you will get VXDN shares and vice versa. This is the Corrective Distribution mechanism. Since Accushares can’t create assets out of thin air, they must compensate for the newly doubled number of shares outstanding by dropping their value by half (or do a 2:1 reverse stock split). The effect of the Corrective Distribution is not obvious. Working through an example is a good way to understand it. Imagine that a CD has been triggered and that a Regular Distribution is about to occur. You own 1,000 shares of VXUP. Let’s assume that the market price of VXUP is $27.5, the VXUP NAV is $25, and that the VXDN NAV is $22 at market close right before the distribution. You would receive a dividend of $3/share due to the resetting of VXUP’s $25 NAV value down to VXDN’s ending cycle value of $22. You would also receive 1,000 shares of VXDN. The new NAV value would be $22/2 = $11/share because Accushares doubled the number of shares outstanding. Before the CD the VXUP shares in your account were worth $27.5 X 1,000 = $27.5K. After the Regular/Corrective Distribution your account has: Your net account value drops to $25K – your $2.5K premium over NAV has disappeared. Any premium over the closing NAV value is wiped out by the CD. The next day VXUP will likely trade at a multiple percentage points over NAV, but your VXDN shares will likely be trading at a symmetrical discount from NAV, so the net value of your shares will remain at around $22K. Accushares has essentially cashed out your account at the NAV price – no premium for you… No diligent shareholder will willingly take this sort of loss, nor short seller pass up this opportunity for profit; the market will ensure the value of these funds converges near to NAV the eve of the distribution. From an entertainment value perspective, there will be a couple of things to watch once the CD mechanism becomes effective: Will traders attempt to prevent CDs from happening? Imagine a scenario where some groups are trying to prevent a CD from happening by selling, or short selling shares, while others hoping to profit from a CD are buying shares hoping to keep the tracking error above 10%. How low will the tracking errors go before the CD date? Short sellers would tend to drive the tracking errors to zero, but the about to expire VIX futures values will be decaying rapidly at that point, so significant intra-day profits might still be available to arbitrageurs on the last days of trading. The net effect of the CD will be to complicate and disrupt an already difficult situation. It won’t fix the funds. What Accushares should do is eliminate the Corrective Distribution. Once broken is better than twice broken. Disclosure: None
Best And Worst: Small Cap Value ETFs, Mutual Funds And Key Holdings

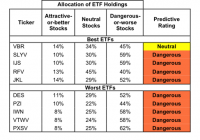
Summary Small Cap Value ranks 11th in 2Q15. Based on an aggregation of ratings of 16 ETFs and 287 mutual funds. VBR is our top rated Small Cap Value ETF and SPSCX is our top rated Small Cap Value mutual fund. The Small Cap Value style ranks 11th out of the 12 fund styles as detailed in our 2Q15 Style Rankings report . It gets our Dangerous rating, which is based on aggregation of ratings of 16 ETFs and 287 mutual funds in the Small Cap Value style. Figures 1 and 2 show the five best and worst rated ETFs and mutual funds in the style. Not all Small Cap Value style ETFs and mutual funds are created the same. The number of holdings varies widely (from 14 to 1511). This variation creates drastically different investment implications and, therefore, ratings. Investors should not buy any Small Cap Value style ETFs or mutual funds because only one gets an Attractive-or-better rating, but it has below $100 million in total net assets. If you must have exposure to this style, you should buy a basket of Attractive-or-better rated stocks and avoid paying undeserved fund fees. Active management has a long history of not paying off. Figure 1: ETFs with the Best & Worst Ratings – Top 5 (click to enlarge) * Best ETFs exclude ETFs with TNAs less than $100 million for inadequate liquidity. Direxion Value Line Small and Mid Cap High Dividend ETF (NYSEARCA: VLSM ) and First Trust Mid Cap Value AlphaDEX ETF (NYSEARCA: FNK ) are excluded from Figure 1 because their total net assets are below $100 million and do not meet our liquidity minimums. Figure 2: Mutual Funds with the Best & Worst Ratings – Top 5 (click to enlarge) * Best mutual funds exclude funds with TNAs less than $100 million for inadequate liquidity. Vanguard Small-Cap Value ETF (NYSEARCA: VBR ) is the top-rated Small Cap Value ETF and Sterling Capital Behavioral Small Cap Value (MUTF: SPSCX ) is the top-rated Small Cap Value mutual fund. Both earn a Neutral rating. One of our favorite stocks held by VBR is Goodyear Tire and Rubber Company (NASDAQ: GT ). In 2014, Goodyear earned an after-tax operating profit ( NOPAT ) of almost $1.4 billion, its highest ever in our model. Despite a 7% revenue decline, the company’s NOPAT was up over 11% year over year. Longer term, NOPAT has risen by 24% compounded annually since 2009. This is a direct result of cost of sales that declined 26% and SGA that declined 4% from 2011, bringing total expenses down by 21%. All of this expense trimming has raised Goodyear’s after-tax margins to almost 8%, up from 4% in 2012 and its return on invested capital ( ROIC ) from under 6% in 2012 to 9% today. Goodyear Tire was our Stock Pick of the Week several weeks ago. Despite the positive growth of the business, the stock is undervalued. If Goodyear can grow NOPAT by just 1% compounded annually for the next 10 years , the company is worth $37/share – a 19% upside from current levels. It will be difficult for Goodyear to fail to beat expectations as low as these when considering the company’s historical profit growth rate since 2000 is 18% compounded annually. PowerShares Fundamental Pure Small Value Portfolio (NYSEARCA: PXSV ) is the worst rated Small Cap Value ETF and Aston River Road Independent Value Fund (MUTF: ARIVX ) is the worst rated Small Cap Value mutual fund. PXSV earns a Dangerous rating and ARIVX earns a Very Dangerous rating. One of the worst rated stocks held by Small Cap Value funds is Almost Family Inc. (NASDAQ: AFAM ). Almost Family provides home health services throughout the United States. Since 2010, Almost Family’s NOPAT has declined from $32 million to $15 million in 2014, a decline of 17% compounded annually. ROIC has also seen a similar decline, down from 19% to 5% over the same timeframe. Almost Family has also generated negative economic earnings for the past two years. Considering the lack of growth shown above, AFAM is currently overvalued. To justify its current price of $39/share, the company would need to grow NOPAT by 15% compounded annually for the next 11 years . This seems very optimistic given that AFAM’s NOPAT has declined since 2010. Figures 3 and 4 show the rating landscape of all Small Cap Value ETFs and mutual funds. Figure 3: Separating the Best ETFs From the Worst ETFs (click to enlarge) Figure 4: Separating the Best Mutual Funds From the Worst Funds (click to enlarge) Sources Figures 1-4: New Constructs, LLC and company filings Disclosure: David Trainer and Allen L. Jackson receive no compensation to write about any specific stock, style, style or theme. Disclosure: I/we have no positions in any stocks mentioned, and no plans to initiate any positions within the next 72 hours. (More…) I wrote this article myself, and it expresses my own opinions. I am not receiving compensation for it. I have no business relationship with any company whose stock is mentioned in this article.

Opportunities In Utilities For Dividend Investors?

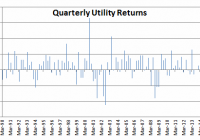
Summary Utilities have produced their worst quarterly returns in 2015 since the financial crisis. Higher interest rates have disproportionately hurt rate-sensitive sectors like utilities. In a relatively fully valued market, the relative underperformance of utilities may present investors an opportunity. The S&P 500 Utility Index, replicated by the Utilities Select Sector SPDR ETF (NYSEARCA: XLU ), has produced a -9.96% return to begin 2015, trailing the S&P 500 (NYSEARCA: SPY ) by over 12%. What has happened? The increase in Treasury yields disproportionately disfavored bond-like stocks with high dividend payouts including utilities and telecom. The trailing dividend yield on the Utilities ETF is now 3.69%. Investors have punished equity sectors with more fixed income-like return streams. After a -5.17% return in the first quarter, the utility index has followed up with a -5.05% return so far in the second quarter. These are the worst returns for the sector since the financial crisis when risk premia on all assets increased as graphed below: Source: Standard and Poor’s; Bloomberg Comparison Versus Bonds For the pounding that interest rate sensitive stocks have taken in 2015, the yield on XLU is still higher than the yield on iShares iBoxx Investment Grade Corporate Bond Index ETF LQD at 3.43%. For the same cash flow stream, I would rather own the equity upside of being a utility shareholder than be the leverage provider by owning their corporate bonds. The -9.96% loss on XLU in the first half has been larger than the -7.54% return on the Barclays Long Treasury Index as proxied by the iShares 20+ Year Treasury Bond ETF (NYSEARCA: TLT ). Conclusion I believe that the utility sector is now relatively cheap, and should be viewed as increasingly attractive to the large Income Investing community on Seeking Alpha. However, I use the term relative as I still expect forward returns on domestic assets to be subnormal . The index I have used as my sector proxy in this article features both gas and electric utilities, fully regulated and a mix of regulated and unregulated business, and features companies located in geographies with different growth trajectories. These utility stocks, at 15.9x trailing earnings, are still collectively trading at a 8% discount to the price Berkshire Hathaway paid for NV Energy in 2013 . Since that purchase in June 2013, the earnings multiple on the broader market has expanded by 13%. Consider this a margin of safety discount to a purchase made by an investor that has a long history of traditionally not paying full sticker price. When Berkshire Hathaway’s ( BRK.A , BRK.B ) MidAmerican Energy Holdings unit bought Pacificorp in 2006, it was reported in Electric Utility Week that Buffett told Oregon regulators that owning utilities was “not a way to get rich – it’s a way to stay rich.” In 2015, utilities have gotten 12% cheaper relative to the rest of the market. Perhaps utilities present dividend-paying investors with long-term horizons an opportunity in a relatively fully valued equity market. Disclaimer: My articles may contain statements and projections that are forward-looking in nature, and therefore inherently subject to numerous risks, uncertainties and assumptions. While my articles focus on generating long-term risk-adjusted returns, investment decisions necessarily involve the risk of loss of principal. Individual investor circumstances vary significantly, and information gleaned from my articles should be applied to your own unique investment situation, objectives, risk tolerance, and investment horizon. Disclosure: I am/we are long SPY. (More…) I wrote this article myself, and it expresses my own opinions. I am not receiving compensation for it (other than from Seeking Alpha). I have no business relationship with any company whose stock is mentioned in this article.