Tag Archives: nreum

Backtesting With Synthetic And Resampled Market Histories

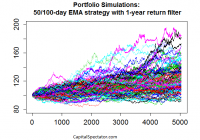
We’re all backtesters in some degree, but not all backtested strategies are created equal. One of the more common (and dangerous) mistakes is 1) backtesting a strategy based on the historical record; 2) documenting an encouraging performance record; and 3) assuming that you’re done. Rigorous testing, however, requires more. Why? Because relying on one sample-even if it’s a real-world record-doesn’t usually pass the smell test. What’s the problem? Your upbeat test results could be a random outcome. The future’s uncertain no matter how rigorous your research, but a Monte Carlo simulation is well suited for developing a higher level of confidence that a given strategy’s record isn’t a spurious byproduct of chance. This is a critical issue for short-term traders, of course, but it’s also relevant for portfolios with medium- and even long-term horizons. The increased focus on risk management in the wake of the 2008 financial crisis has convinced a broader segment of investors and financial advisors to embrace a variety of tactical overlays. In turn, it’s important to look beyond a single path in history. Research such as Meb Faber’s influential paper “A Quantitative Approach to Tactical Asset Allocation” and scores of like-minded studies have convinced former buy-and-holders to add relatively nimble risk-management overlays to the toolkit of portfolio management. The results may or may not be satisfactory, depending on any number of details. But to the extent that you’re looking to history for guidance, as you should, it’s essential to look beyond a single run of data in the art/science of deciding if a strategy is the genuine article. The problem, of course, is that the real-world history of markets and investment funds is limited-particularly with ETFs, most of which arrived within the past ten to 15 years. We can’t change this obstacle, but we can soften its capacity for misleading us by running alternative scenarios via Monte Carlo simulations. The results may or may not change your view of a particular strategy. But if the stakes are high, which is usually the case with portfolio management, why wouldn’t you go the extra mile? The major hazard of ignoring this facet of analysis leaves you vulnerable. At the very least, it’s valuable to have additional support for thinking that a given technique is the real deal. But sometimes, Monte Carlo simulations can avert a crisis by steering you away from a strategy that appears productive but in fact is anything but. As one simple example, imagine that you’re reviewing the merits of a 50-day/100-day moving average crossover strategy with a one-year rolling-return filter. This is a fairly basic set-up for monitoring risk and/or exploiting the momentum effect, and it’s shown encouraging results in some instances-applying it to the ten major US equity sectors, for instance. Let’s say that you’ve analyzed the strategy’s history via the SPDR sector ETFs and you like what you see. But here’s the problem: the ETFs have a relatively short history overall… not much more than 10 years’ worth of data. You could look to the underlying indexes for a longer run of history, but here too you’ll run up against a standard hitch: the results reflect a single run of history. Monte Carlo simulations offer a partial solution. Two applications I like to use: 1) resampling the existing history by way or reordering the sequence of returns; and 2) creating synthetic data sets with specific return and risk characteristics that approximate the real-world funds that will be used in the strategy. In both cases, I take the alternative risk/return histories and run the numbers through the Monte Carlo grinder. Using R to generate the analysis offers the opportunity to re-run tens of thousands of alternative histories. This is a powerful methodology for stress-testing a strategy. Granted, there are no guarantees, but deploying a Monte Carlo-based analysis in this way offers a deeper look at a strategy’s possible outcomes. It’s the equivalent of exploring how the strategy might have performed over hundreds of years during a spectrum of market conditions. As a quick example, let’s consider how a 10-asset portfolio stacks up in 100 runs based on normally distributed returns over a simulated 20-year period of daily results. If this was a true test, I’d generate tens of thousands of runs, but for now let’s keep it simple so that we have some pretty eye candy to look at to illustrate the concept. The chart below reflects 100 random results for a strategy over 5040 days (20 years) based on the following rules: go long when the 50-day exponential moving average (NYSEMKT: EMA ) is above the 100-day EMA and the trailing one-year return is positive. If either one of those conditions doesn’t apply, the position is neutral, in which case the previous buy or sell signal applies. If both conditions are negative (i.e., 50-day EMA below 100 day and one-year return is negative), then the position is sold and the assets are placed in cash, with zero return until a new buy signal is triggered. Note that each line reflects applying these rules to a 10-asset strategy and so we’re looking at one hundred different aggregated portfolio outcomes (all with starting values of 100). The initial results look encouraging, in part because the median return is moderately positive (+22%) over the sample period and the interquartile performance ranges from roughly +10% to +39%. The worst performance is a loss of a bit more than 7%. The question, of course, is how this compares with a relevant benchmark? Also, we could (and probably should) run the simulations with various non-normal distributions to consider how fat-tail risk influences the results. In fact, the testing outlined above is only the first step if this was a true analytical project. The larger point is that it’s practical and prudent to look beyond the historical record for testing strategies. The case for doing so is strong for both short-term trading tactics and longer-term investment strategies. Indeed, the ability to review the statistical equivalent of hundreds of years of market outcomes, as opposed to a decade or two, is a powerful tool. The one-sample run of history is an obvious starting point, but there’s no reason why it should have the last word.
Risk Factors Drive Lazard’s Systematic Approach To Core Investing

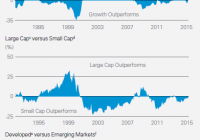
By DailyAlts Staff Core investments are those that anchor the portfolio. Typically, investors pursue exposure to broad-market benchmarks, such as S&P 500 or MSCI indexes for stocks, and the Barclays Aggregate Index for bonds, as part of their core holdings, with the intent of minimizing the unexpected. But rather than passively investing in index funds, Lazard (NYSE: LAZ ) thinks investors should take a systematic approach to implementing core investing strategies, and that is the subject of the firm’s latest Investment Focus white paper: Core Advantage: The Case for a Systematic Approach to Core Investing . The Non-Systematic Approach Managers pursuing non-systematic approaches to providing core exposure suffer from several pitfalls, first among which is the tendency for them to introduce unwanted risks to a portfolio in pursuit of benchmark-beating returns. This can happen from overweighting stocks according to style, market cap, or geographic region. While it might prove rewarding under certain market environments, it can result in outsized losses when trends unexpectedly reverse, and this is not what most investors are looking for from their core holdings. The image below shows how market favor has vacillated over time, shifting between growth and value stocks; large caps and small; and developed and emerging markets: The Systematic Approach The authors of Lazard’s paper believe the systematic approach is the best for core investing, because it allows managers to maintain stricter parameters relative to their benchmark, by ensuring against concentration according to market cap, sector, or country. Additionally, using a rules-based, data-driven, and systematic approach allows managers to analyze hundreds, even thousands of stocks within a given universe, in real-time using a bottom-up process; and to combine “robust risk management” with stock selection. How does it work? Well, according to Lazard, various risk factors have been rewarded by markets over time, including valuation, sentiment, and quality, as depicted in the image below: Valuation compares a company’s price to its peers and its own historical record, and favors companies that are inexpensive and offer long-term value. It’s a contrarian approach, and investors need to be prepared to endure short-term, unrealized losses. Sentiment is gauged by looking at the stock’s price strength, relative to the other stocks in its sector and broader benchmark, as well as analyst upgrades. In Lazard’s approach, liquidity is also taken into account by looking at volume-weighted momentum, and companies with strengthening momentum are favored while those with weakening momentum are disfavored. Quality is assessed by stability of returns and low earnings-volatility. According to Lazard, quality stocks are often those in the process of “migrating” from the realm of growth stocks to that of value. Systematic Evolution Systematic investing avoids concentrating investments in any one area and seeks to maintain a composition similar to that of its benchmark. This requires what Lazard calls an “evolving approach,” wherein investment professionals are constantly researching and testing potential improvements to the investment process. Lazard’s own approach, as implemented by the Lazard Equity Advantage team, is “uniquely positioned to help clients achieve their investment goals,” according to Lazard. “This has proved to be a solid foundation on which to build equity asset class exposure – especially through core approaches – and long-term investment program success.” For more information, download a pdf copy of the white paper .

Can Investing With Activist Investors Produce Alpha?

Investing the day after an activist investor announces a large stake can produce alpha. The strategy over 34 activist stakes generated 18.12% per year, nearly 4% more than the S&P 500. We can replicate the process through 13F and 13D filings. The hedge fund industry’s current AUM is about 2.5 trillion. Of that number, about half is allocated to public equity and an even smaller number is dedicated to activist investment. So why do we care about activist investment so much? Perhaps it is American sensationalism or maybe we just like a good story, but whatever it is, every day we hear from the likes of Carl Icahn or Bill Ackman on CNBC, or in another media outlet. These brilliant and powerful investors outline their plan to unlock value in company XYZ, as if they are screaming from the top of the mountain for all to hear, through share buybacks, managerial shakeups, spin-offs, or other strategic planning and then back up their story with war chests full of their investors’ capital. As average investors, we are intrigued to see what the pros are doing, but we do not have access to these investors’ funds. So, how do we join in on the fun with these modern-day yodelers? We follow them closely and invest with them. But will this strategy generate alpha? The following study will provide the conclusion. I looked at 34 previous activist investments from some of the biggest players in the business. I took the share price of the day after the activist announced a position and marked this as a buy. We can follow activist activity through 13F filings online and through 13D filings in Barron’s. I then compared it to the day after the activist either won or lost proxy vote, or exited the position. The study will focus on long only as many average investors do not short or have the capability to do so. For example, we would buy Valeant Pharmaceuticals (NYSE: VRX ) the day after Bill Ackman announces a hostile takeout bid for Allergan (NYSE: AGN ), and then sell Valeant Pharmaceuticals the day Allergan rejected the offer and took the actavist’s bid. I then compared the returns of the individual stock to the market return of the S&P 500 over that time period to find if investing alongside the most famous hedgies in the world can generate alpha. Please read through for the data and the conclusion. Company Activist Activity Date Bought Date Sold Total Time held Share Price Buy Share Price Sell P/L S&P 500 Return Beta of Stock Reason for Activism Pershing Square Capital Management Allergan and Valeant 4/21/2014 10/18/2014 0.49 135 142 5.19% 0.79% 0.46 Buy out of Allergan. I calculated until the failure date to purchase Allergan. Pershing Square still owns a large portion. Bill Ackman J.C. Penney (NYSE: JCP ) 10/9/2010 9/2/2013 2.90 34 14.27 -58.03% 41.00% 1.34 Shake up of company. Appointment of Ron Johnson to CEO. Board Member. Failure. Air Products and Chemicals (NYSE: APD ) 9/1/2013 6/26/2015 1.82 109 143.83 39.95% 28.21% 1.42 Shake up of management, mainly CEO. Canadian Pacific Railway (NYSE: CP ) 10/31/2011 6/26/2015 3.66 61 162 167.67% 67.75% 1.07 Shake up of management. Trian Partners Nelson Peltz DuPont (NYSE: DD ) 7/18/2013 5/18/2015 1.83 57 70 27.81% 25.83% Spin-off of chemical units, break up of company. Tiffany (NYSE: TIF ) 2/27/2007 9/30/2011 4.59 45 63 48.00% -18.44% 1.93 Management shakeup. Undervalued. Wendy’s (NASDAQ: WEN ) 5/3/2008 6/26/2015 7.15 7.35 11.4 66.10% 51.43% 0.51 Management shakeup. Undervalued. Icahn Enterprises Carl Icahn Apple (NASDAQ: AAPL ) 10/25/2013 6/26/2015 1.67 75 127.5 72.50% 19.47% 1.07 Share buyback. Undervaluation. Dell 3/7/2013 9/10/2013 0.51 14 13.85 0.43% 8.56% — Transocean (NYSE: RIG ) 1/15/2013 6/26/2015 2.45 56.76 16 -62.81% 42.71% 1.6 Increase dividend. Undervalued Navistar (NYSE: NAV ) 11/20/2011 6/26/2015 3.60 38 22.75 -40.13% 81.44% 3.12 Restructuring. Management changes Starboard Value Jeffrey Smith Darden (NYSE: DRI ) 12/23/2013 6/26/2015 1.51 54.5 71.83 37.80% 15.01% 0.69 Restructuring, reevaluate strategic positioning, and managerial changes. MeadWestvaco (NYSE: MWV ) 6/3/2014 6/26/2015 1.06 43.63 47.89 17.76% 9.25% 0.55 Spin-off of specialty chemicals unit, undervalued, and sale of company. Brink’s (NYSE: BCO ) 5/4/2015 6/26/2015 0.14 30.61 30.23 -1.24% -58.00% 1.72 No plans as of yet. Office Depot (NASDAQ: ODP ) 8/8/2013 6/26/2015 1.88 4.2 8.89 111.67% 23.85% 2.75 Push for OfficeMax deal and sale of company to Staples (NASDAQ: SPLS ). AOL (NYSE: AOL ) 12/22/2011 6/15/2012 0.48 15.5 25.5 64.52% 6.13% — Managerial shakeup. Loss in proxy vote. Smithfield 6/18/2013 9/26/2013 0.27 33.11 33.99 2.66% 4.28% — Attempted breakup of company and sale. Failure and Chinese takeover by Shanghui took place at 34 a share. Gamco Mario Gabelli Brink’s 12/16/2014 6/26/2015 0.53 22.92 30.17 32.38% 6.57% 1.72 Gabelli claims that Brink’s is undervalued and should be private. Griffin Land (NASDAQ: GRIF ) 11/26/2013 6/26/2015 1.58 33 32.26 -1.49% 16.62% — Gabelli wants GRIF to examine itself as a REIT or MLP. Superior Industries (NYSE: SUP ) 11/26/2013 6/26/2015 1.58 18.9 18.69 4.89% 16.62% 0.93 Gabelli wants a share repurchase program. Third Point Dan Loeb Yahoo (NASDAQ: YHOO ) 10/3/2011 7/29/2013 1.82 15.47 27.65 78.73% 49.66% 1.46 Proxy vote success and shake up of board. Marissa Meyer new CEO. Jana Partners Barry Rosenstein McGraw-Hill (NYSE: MHFI ) 8/2/2011 9/12/2011 0.11 37.77 40.51 7.25% -7.78% 1.64 Breakup of company. Marathon Petroleum (NYSE: MPC ) 1/21/2012 2/20/2012 0.08 31.24 35 12.04% 4.15% 1.02 Operational changes to company and potential breakup. Agrium (NYSE: AGU ) 10/20/2012 3/5/2014 1.38 68.7 93.56 43.19% 30.69% 0.87 Return of capital to shareholders and split business. Ashland (NYSE: ASH ) 4/28/2013 5/13/2015 2.04 86 128.59 52.52% 31.81% 0.71 Restructuring, recapitalizations, spin-offs. Safeway (NYSE: SWY ) 8/20/2014 1/29/2015 0.44 24 35.1 46.25% 1.45% — Merger arb. and restructuring. QEP Resources (NYSE: QEP ) 10/22/2013 10/16/2014 0.98 32.9 23.33 -29.09% 6.66% 1.23 Midstream unit breakup. Elliot Management Paul Singer Hess (NYSE: HES ) 12/1/2012 6/26/2015 2.57 50 68.48 40.96% 49.16% 1.78 Managerial shake up and capital allocation changes. ValueAct Jeffrey Ubben Adobe (NASDAQ: ADBE ) 12/27/2011 1/13/2015 3.04 38.13 74.04 98.18% 58.32% 1.31 Managerial shake up. Moody’s (NYSE: MCO ) 7/20/2011 6/26/2015 3.93 35.61 110.2 213.46% 56.30% 1.36 Managerial shake up. Motorola 7/17/2011 6/26/2015 3.94 46.5 58.1 33.95% 56.30% 0.59 Work with management to unlock value. Relational Ralph Whitworth Occidental (NYSE: OXY ) 8/3/2010 5/3/2013 2.75 72.35 85.58 27.29% 43.22% 1.17 Removal of CEO, Ray Irani. Clinton Group Greg Taxin Violin Memory (NYSE: VMEM ) 12/19/2013 10/16/2014 0.83 4 4.16 4.00% 2.44% — Sale of company. (Taxin leaves Clinton Group on 10/16/14) XenoPort (NASDAQ: XNPT ) 10/15/2013 10/16/2014 1.00 6.02 6.41 6.48% 8.20% — Replace CEO. Total 34 Averages: 1.90 34.44% 26.93% 1.31 Return Per Year: 18.12% 14.17% Based on the data set, we see that following activist hedge funds does produce alpha. Over the course of the average investment of 1.90 years, the activist strategy returns an average of 18.12% per year versus the S&P 500 return of 14.17% over that time period. However, not taken into account are the trading costs of the transactions or the value of your time following the hedge fund activists. One important aspect to consider is that the average betas of the stocks are about 1.31. The higher return of the activist hedge fund strategy could just be a product of taking on more volatility to the market and may not represent any innate stock-picking ability. Another aspect to consider as an investor is whether or not activists add value (if you care about such a thing), as this can be widely debated. Did Valeant or Allergan add value when Ackman attempted to play matchmaker? Probably not, but there was still money to be made. Another important aspect to consider is when this study was done. All of the activist investments were done during the recent bull market that has generated returns of over 200% in six years. It has been shown that activists can even beat the market in periods of rapid asset appreciation, so I would hypothesize that a strategy of following activist investors would also be successful in a sideways or bear market. However, I do not have the empirical research to prove such a claim as the proliferation of activist investors has only just begun. This can provide a potential issue. As activist investors prove to make a lot of money and beat the market, we will see an influx of assets to this strategy that could dull down returns. I believe that this will not be an issue as you should always follow the big guys that have been doing this type of investing for a long time, for example, Bill Ackman, Dan Loeb, Mario Gabelli, Carl Icahn, Jeffrey Smith, Nelson Peltz, and Barry Rosenstein. There is one takeaway that is important to note after conducting this study. Picking activist investors are just like picking stocks, some are good during some times, and some not. Not all activist investors will always lead to gains every time, just like stocks. My advice is to evaluate an activist pick and only if you like the stock independently of the activist involvement, then buy in, otherwise you are better off in an index, like the SPY or MDY . If you do not know why you own something, don’t own it. Do your own work, but you can use these guys as idea generators. Do not follow Carl Icahn blindly into battle, even if he seems to be on a hot streak, because the market humbles everyone, even Mr. Icahn. Disclosure: I/we have no positions in any stocks mentioned, and no plans to initiate any positions within the next 72 hours. (More…) I wrote this article myself, and it expresses my own opinions. I am not receiving compensation for it (other than from Seeking Alpha). I have no business relationship with any company whose stock is mentioned in this article.