Tag Archives: nreum

The SPDR S&P Global Dividend ETF: Do High Yield Dividend ETFs Reach Too Far?

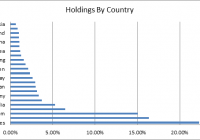
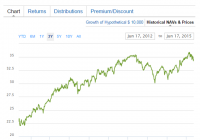
A globally diversified, passive, total return fund which seeks very high dividend payouts. Several of its heaviest weighted companies pay dividends in excess of net income. Several heavily weighted assets have dividends potentially at risk. We all know the famous biblical anecdote of David interpreting the Pharaoh’s dream. There were to be seven years of plenty followed by seven years of famine. Pharaoh heeded the analysis and prepared the kingdom for the lean years. It’s fair to say that this might have been history’s very first documented investment advice. It required discipline to make the right choices at the right time and then stick to a plan. Comparatively speaking one might say that these are lean year for dividends but it certainly won’t remain this way forever. So, how should a retirement portfolio be positioned for both the lean and fat years? One way is to invest in a dividend focused ETF, but the investor must tread carefully here. The idea is not just to get a dividend return, but to also minimize risk. The important at-a-glance metrics to examine carefully are: trailing dividend yields, payout to net income ratio and the strength of cash flow. These three will give an indication of consistency and sustainability of the current dividend. Here’s one example: State Street Global Advisors’ SPDR S&P Global Dividend ETF ( WDIV ) . According to State Street , the fund’s objective is ” to seek to provide investment results that, before fees and expenses, correspond generally to the total return of the S&P ® Global Dividend Aristocrats Index.” The prospectus states that the fund’s strategy is to invest in a subset of the index, being at least 80% invested at all times. Some key rules are: investing in securities having paid increasing or stable dividends for at least ten years, a market cap of at least $1 billion, an average daily trade value of at least $5 million, a non-negative ‘Dividend to Net Income ratio’ and a maximum indicated dividend yield of 10%. Under these rules, the top 100 qualified stocks are selected with no more than 20 companies from any one country. The weightings of individual holdings are capped at 3% and individual country weightings capped at 25%. (source: WDIV ) The top five country weightings accounting for 65.72% of the fund are: United States, 21.59%; Canada, 15.71%; United Kingdom, 14.52%; France, 6.66% and Australia at 6.64%. EU member nations account for 35.08% of the fund. One must also consider that the fund includes companies based in emerging market countries such as South Africa, Thailand, Brazil and Malaysia, comprising 6.26% of the fund. The fund’s prospectus makes no mention of currency hedging, hence there’s a currency risk although the fund’s broad global diversification should mitigate those risks. 29.62% of the fund is held in cyclically defensive sectors: Utilities, 15.33%, Consumer Staples, 11.22% and Health Care, 3.07%. Those sectors most affected by economic cycles comprise 36.7% of fund: Financials, 25.45%, Consumer Discretionary, 7.74% and Materials, 2.98%. Lastly, 34.21% are held in semi-cyclicals (or cyclically sensitive), 11.65% in Industrials, 10.13% in Energy, 8.36 in Telecom Services and 4.07 in IT. (source: WDIV ) The following gives a snapshot of the top ten holdings with yields and dividend statistics. HollyFrontier Corp (NYSE: HFC ), the fund’s top holding at 2.61%, is a U.S. based petroleum refiner, processing 443,000 barrels per day producing gasoline, diesel, jet fuel, asphalt and lubricants. HFC operates 5 refineries through subsidiaries and also owns a 39% interest in Holly Energy Partners. Its dividend yield is 3.20%, and above the 1.68% industry average in the volatile oil industry. Over the past 5 years its average yield is 3.22%. Its trailing 12 month target payout ratio is high at 155.14% of net income; however, it manages to pay consistently, with a 5 year dividend growth rate of 61.15%. The share price to cash flow multiple is 10.65, well within the average S&P price to cash flow multiple of 14 times. Neopost ( OTCPK:NPACY ), at 1.67% of holdings, is a global provider of mailing solutions, digital communications and shipping services, based in Bagneux, France. The company services 90 countries with subsidiaries in 31 of those. Neopost targets small and midsized companies in Europe although 40% of its business is from North America. To put Neopost in perspective, its primary competitor in the industry is Pitney Bowes . The ADR carries a semiannual dividend of $0.1357, or 7.98% annually. Its dividend yield 9.62% is well above the industry average, 2.65%. Similarly, its 5 year average dividend yield of 7.20% is also well above the industry average at 2.66%. Neopost’s target payout ratio is just over 100% of net income, with a 5 year 1.10% dividend growth rate; the share price to cash flow multiple is 7.61. In other words, Neopost dividend target is 100% of income however manages to sustain and grow their dividend. U.S. based R.R. Donnelley & Sons Company (NASDAQ: RRD ), at 1.63% of holdings. What R. R. Donnelley does may best be described as ‘getting the message across’, through publishing, retail services, digital print, books, magazines, catalogs, inserts, statements and manuals for its clients. Donnelley’s dividend yield of 5.75% is well above the industry average 2.25% yield. Its 5 year 6.67% yield average also tops the industry’s 3.04% average. It needs to be noted that Donnelley’s expected payout ratio is 123.3, indicating that, technically, it’s distributing more than it earns. Over the past 5 years dividend growth is nil and it has a price to cash flow multiple of 4.71, possibly indicating declining revenues and a low share price Coca-Cola Amatil Limited ( OTCPK:CCLAF ), 1.45% of holdings, based in Sydney, Australia. Amatil is Coca-Cola’s bottler and distributor serving the South Pacific region. Amatil’s dividend yield is 3.28%, has a 5 year average yield of 2.28 but, importantly, has a sustainable payout ratio of 77.44% of net income, a 5 year dividend growth rate of 8.72% and priced at a somewhat high 22.42 times cash flow. This is a solid dividend paying holding. Centrica ( OTCPK:CPYYY ), 1.43% of holdings, whose business is in ‘ every stage in the energy chain ‘, from sourcing on the industrial side to servicing on the consumer side. Centrica employs 30,000 in the U.K., Ireland, Europe, North America and Trinidad. Centrica’s dividend yield is 4.91% and has a 5 year average yield 4.84%. Its 5 year dividend growth rate is 1.07%. Due to falling energy prices Centrica cut its dividend to nearly zero. Its expected payout ratio is 0.00%. Shares are priced at 5.99 times cash flow. (click to enlarge) (source: combined) Wm Morrison Supermarkets ( OTCPK:MRWSF ), 1.43% of holdings. As the name implies it’s a retail supermarket chain and offers home delivery. It’s the 4th largest supermarket chain in the U.K. Wm Morrison has fallen on tough times and this is one of the weaker holdings. Shares have fallen 15% in the past 52 weeks. However, Q1 sales did improve and market share remained steady at 10.9%. It will be removed from the FTSE 100 and placed in the FTSE 250. Although the historical statistics indicate that the company paid a 0.5004 semiannual dividend, has a 5 year average dividend yield of 4.48% and a 5 year dividend growth rate of 10.73%, it’s necessary to point out that the company has a negative P/E at -21.65. In March of 2015 the dividend was cut 63%. Hence, a second company in the top ten with an expected 0.00% payout ratio. Currently, it is selling at approximately 4.02 times cash flow Universal Corporation (NYSE: UVV ), 1.42% of holdings, is a global supplier of cured leaf tobacco for consumer tobacco product manufactures. Their services include packing, storing and financing. Universal conducts business in 30 countries and employs 24,000 permanent and seasonal workers. The Company pays a $0.52 share dividend or 3.67% annualized, a 5 year dividend average of 3.97%, a 5 year dividend growth rate of 2.06% and a sustainable expected payout ratio of 47.36%. Shares are priced at 8.95 times cash flow, well inside the S&P average. Not only is Universal a solid dividend paying company, but its target payout ratio has plenty of room to grow. UBM PLC ( OTCQX:UBMPY ), 1.40% of holdings, is a London based marketing, communications and media consultants, specializing in digital services as well as ‘person-to-person’ events, such as trade shows, exhibitions, conferences and live events. Its ADR carries a semiannual $0.16 per share dividend, 3.74% annually, well above the industry average of 1.48%. Its 5 year average yield is 3.97% with a 5 year dividend growth rate of 2.06%. The payout ratio is a very sustainable 47.36%. It recently announced a dividend of $0.24. The company has also been recently upgraded by leading analyst, for example Societe Generale ( OTCPK:SCGLY ) and BNP Paribas ( OTCQX:BNPQY ), to ‘buy’. UBM’s expected payout ratio is 58.26% of earnings and is priced at 12.40 time cash flow. The sustainable payout ratio, analyst upgrades and cash flow multiple within the S&P’s average makes it a solid holding. Williams Companies (NYSE: WMB ), Inc., 1.38% of holdings, is a U.S. based and recognized by Forbes as the most admired energy company for 2015. It is a supplier of liquid natural gas, olefins used in plastics production, owns interstate natural gas pipelines and processes oil-sands. Williams Companies provides services through subsidiaries such as Transco , Gulfstream and Northwest Pipeline . The company pays a quarterly dividend of $0.59 per share, annualized to about 4.86%, a 5 year average yield of 3.24%, a very notable dividend growth rate of 26%, a sustainable payout ratio of 76.96% of net income and trades at 10.36 times cash flow. Williams is a well-founded dividend paying asset. New York Community Bancorp Inc. (NYSE: NYCB ) at 1.36% of holdings, is a New York State Charted Bank Holding Company of New York Community Bank and New York Commercial Bank . These subsidiaries service both consumers and business banking needs in New York City, New Jersey, Florida, Ohio and Arizona. The holding company pays a quarterly dividend of $0.25, about a 5.85% annual yield, a strong 5 year average yield of 6.48%, but having no dividend growth over those 5 years compared to the industry average of 18.04% dividend growth. Its expected payout ratio is high but sustainable at 90.92% and trades at 15.84 times cash flow, slightly above the S&P average. With an improving U.S. economy, particularly in the Florida housing market, it may well be worth the risk. (click to enlarge) The fund is diversified with 102 holdings and a dividend yield of 3.95%; 3.84% less fees and expenses. The recent fixed income selloff may have contributed to the -2.40% one month return. Year to date the fund returned 3.30% and since inception, 9.21%. The average top ten cash flow multiple is 10.3. This may be compared with the benchmark MSCI S&P ® Global Dividend Aristocrats Index yield of 4.61% and a price to cash flow multiple of 8.17. The fund’s FY1 P/E ratio is 15.30, identical with the index as well as the 5 years earnings growth of 5.44%. The market capitalization of the fund is $63.51 million with 950,000 shares outstanding. Currently the market premium is 0.73% over NAV and total management fees are 0.40% annually. (source: WDIV ) There are similar funds for instance the Guggenheim S&P Global Dividend Opportunities Index ETF (NYSEARCA: LVL ), weighted towards Energy, Financials and Utilities. However, just looking at a few of the most heavily weighted companies revealed payout ratios in the hundreds and several others currently having 0.00% payout targets. Another high yield dividend focused ETF, the First Trust Dow Jones Global Select Dividend Index ETF (NYSEARCA: FGD ), also had similar metrics. Since WDIV is a rule based passively managed fund, one should expect variations as companies are dropped or added to the fund as the rules guided metrics change. Generally speaking, though, there are several heavily weighed components which do pay a high dividend, but those dividends are potentially at risk. Granted, the fund will adjust for that, but the question becomes whether or not the passively managed fund will make those changes in a timely manner. The investor must keep the goal in mind and what the alternatives are. The most secure assets like U.S. Treasuries, AAA rated foreign sovereign or even the largest most solidly founded corporations are very highly priced, hence have lower yields. Paying up for such small returns is not a good strategy, especially when a correction is almost certain to happen when the major central banks unwind their QE programs. Similarly, just reaching for the highest yields without regard to risk will lead to similar ‘negative’ results. High yielding ETFs might be okay if an investor has available ‘risk capital’, but generally, these funds seem to be reaching a little too far out on the limb to stake a major portion of one’s capital in the interim. Editor’s Note: This article discusses one or more securities that do not trade on a major U.S. exchange. Please be aware of the risks associated with these stocks. Disclosure: I/we have no positions in any stocks mentioned, and no plans to initiate any positions within the next 72 hours. (More…) I wrote this article myself, and it expresses my own opinions. I am not receiving compensation for it (other than from Seeking Alpha). I have no business relationship with any company whose stock is mentioned in this article. Additional disclosure: CFDs, spread betting and FX can result in losses exceeding your initial deposit. They are not suitable for everyone, so please ensure you understand the risks. Seek independent financial advice if necessary. Nothing in this article should be considered a personal recommendation. It does not account for your personal circumstances or appetite for risk.

IGR Vs. AWP: What’s A Yield Worth?

CBRE Clarion Global Real Estate Income Fund and Alpine Global Premier Properties Fund both provide access to global real estate. However a comparison between the two brings up an interesting distinction on the distribution front. Do you want yield at the expense of NAV growth or yield and NAV growth? I was recently asked to take a look at the CBRE Clarion Global Real Estate Income Fund (NYSE: IGR ). IGR is a CEF that focuses, as its name implies, on real estate across the globe. This, inevitably brings with it a comparison to a fund like the Alpine Global Premier Properties Fund (NYSE: AWP ). At the core, they both do similar things and could, arguably, be interchangeable. However, income seekers might be drawn to AWP’s nearly 9% yield over IGR’s lower 6.5% yield. And why not, since they do about the same thing? A lot alike In fact, both have similar discounts right now, with each floating around a mid-teens discount to net asset value. So either one would be cheap. Performance is a bit of mixed bag, however, with IGR outdistancing AWP over the trailing five years through May on an NAV total return basis, which includes reinvested dividends. But AWP beating IGR over the trailing three years. More recently, AWP has handily outperformed, posting a year to date gain of nearly 7% versus a 1.5% decline at IGR’s (both including distributions). Looking at standard deviation, a measure of price volatility, IGR was less volatile over the trailing five years and roughly equally volatile over the trailing three years. So it’s hard to make much of a distinction on this point between the two. That said, both make use of leverage , but they have each kept that to a relatively low level recently at around 6% of assets. Cost wise, IGR has a slight edge . It’s expense ratio is roughly around 1.15%. AWP’s expense ratio is a little higher at around 1.3% or so. Neither, however, is so high that they stand out. So here are two funds with roughly similar objectives. Both are trading at steep discounts. But AWP has a notably higher yield and has been performing better of late. The easy answer is buy AWP. That said, you wouldn’t be buying a bad fund if you chose IGR. Pick your poison? Things aren’t that simple, however. And a quick look at the distributions helps explain why. Since it’s IPO in 2004 , IGR has paid investors over $13 worth of distributions. The IPO NAV of the CEF was $14.10. True, the shares currently trade below that level, with an NAV of close to $9.50, but for income investors the benefit has been fairly large despite the NAV decline. Alpine, meanwhile, started life in 2007 with an NAV of around $19 a share. It’s net asset value is roughly $7.50 a share more recently. It’s distributions over that span have been around $6.50 a share. I’m rounding in both cases, but the point should be pretty clear. But just for fun, if you add the current NAV to the total distributions received for both funds you get around $23 for IGR and nearly $16 for AWP. Since IGR had an NAV at IPO of around $14 and AWP’s NAV at IPO was a touch over $19, which one has been the better option? Since 2007 was a pretty awful time to open a fund that may not be a completely fair comparison. But the same trend holds true over shorter periods, too. Let’s look since 2010 instead (using fiscal years for AWP). Over that span, AWP’s NAV has gone from roughly $7.25 a share in October of 2009 (the end of its fiscal year) to $7.50 a share. It’s paid out around $3.75 in distributions. IGR, meanwhile, has seen its NAV go from about $7.50 at the start of 2010 (it’s fiscal year ends in December) to about $9.50. Meanwhile it’s paid out about $2.90 a share in distributions. If all you are looking for is income, yes, AWP paid out more in distributions. But at the cost of NAV growth, since the NAV rose only about 3% over the span. With IGR, there was less income, but your principal grew by around 25%. In other words, if you buy AWP, your return is almost all in the distribution. That’s fine during good times, but when there’s a bad market it makes building back the NAV that much harder to achieve and can result in distribution cuts if the downturn is long enough. Your call, but I like conservative At the end of the day, which option is better for you really depends on your situation and temperament. If you only care about income, AWP is the clear winner. For me, I’d prefer a fund with a lower yield and net asset value growth. So, there’s reasons to like AWP over IGR, but I’d go with the more conservative distribution if I were making the choice. Disclosure: I/we have no positions in any stocks mentioned, and no plans to initiate any positions within the next 72 hours. (More…) I wrote this article myself, and it expresses my own opinions. I am not receiving compensation for it (other than from Seeking Alpha). I have no business relationship with any company whose stock is mentioned in this article.

The iShares MSCI Switzerland Capped ETF: A Fund Worth Yodeling About

An established fund whose top holdings include premier global companies. The heaviest weightings have low volatility, are cyclically defensive and have above average dividend yields. The fund is diversified, yet intelligently structured with a strong defensive bias. Switzerland has been the financial safe haven for centuries and naturally, most people think of those legendary ‘Swiss Banks’. What goes mostly unnoticed, though, is their well-diversified export economy with global reach through premier companies. BlackRock’s iShares MSCI Switzerland Capped ETF (NYSEARCA: EWL ) offers perhaps the best product for a long term investment. First, the EWL’s fees and expenses are capped, although the prospectus does not seem to differentiate its management fees formula for capped or uncapped funds. The fund’s objective is to ” track the investment results of an index composed of Swiss equities” in particular, targeting 85% of the MSCI Switzerland 25/50 index of large and mid-cap companies. (click to enlarge) (Source: iShares) The fund’s nets assets are over $1.228 billion invested in 40 holdings. There are over 35.6 million shares outstanding and it trades an average of 115,744 a session. It currently trades at a premium of 0.79% to its Net Asset Value. The average P/E ratio of total holdings is 18.12. The average price to book is 2.39. The share’s beta is 0.79, i.e., it will move about 0.79 points for every 1 point market move, hence, it is less volatile than the aggregate market. The fund’s dividend return is 2.28% at 0.788 per share. The fund’s top holding is the consumer staples giant, Nestlé ( OTCPK:NSRGY ) at 16.0708% of the fund. Nestlé ‘s has 197 operations worldwide. It’s interesting to note that neither Consumer Staples nor food products account for a very large portion of Swiss exports. Coffee is largest percentage of any food export at 15th and 0.72% of total Swiss exports, then chocolate, 46th at 0.30% of Swiss exports. Nestlé’s business model utilizes a global production and distribution network. It procures, produces and distributes regionally from its factories located abroad: Europe has 136 locations, the Americas have 163 and Asia, Oceania and Africa, 143 combined. Hence, Nestlé is insulated from a strong Swiss Franc and can compete regionally. Nestlé is the only Consumer Staple in the top ten but the fund’s largest holding. Nestles ‘ ADR carries a 3.06% annualized dividend of $2.276, a P/E of 16.45, an EPS of 4.52 and a remarkably low beta of 0.521. Nestles sources ingredients responsibly, establishing minimum standards and product ‘traceability’ from 165,000 suppliers and 680,000 individual farmers. Nestles prides itself on its environmental and sustainability requirements. For example, Nestles is currently upgrading its California bottling plants to operate as a ‘zero water use facilities’. (Source: iShares) The second largest holding is Novartis (NYSE: NVS ), at 15.3964% and third, Roche Holdings ( OTCQX:RHHBY ) at 12.9567%. Again, it’s important to note some basic facts of these two premier healthcare companies. Novartis pays an annual 2.33% dividend of $2.259 per share, has a P/E of 23.38 and a low market beta of 0.77. Novartis produces Cardio Metabolic, Retina, Respiratory and Oncology therapeutics. Two familiar subsidiaries are Alcon, the eye care products company and Sandoz, the generic drug manufacturer. Roche ADRs carry a 2.83% annual dividend yield of $1.004, has a P/E of 26.38 and a market beta of 0.5. In addition to diagnostics and screening solutions, therapeutics drugs produced by Roche target Diabetes, Hepatitis, Leukemia, anti-rejection, and West Nile Virus to name a few. Lastly, as it is with Nestles, Novartis and Roche are, philanthropic, socially responsible and have strong sustainability and environmental impact policies. In total 39.5784% of the funds top 10 holdings are in Healthcare, and account for 88.91% of total Healthcare holdings. Financials comprise 20.33% of the fund’s holdings. Financials in the top ten include, UBS Group (NYSE: UBS ), 4.6014%, Zurich Insurance Group ( OTCQX:ZURVY ), 4.0688% ; Credit Suisse (NYSE: CS ), 3.7144% and Swiss Re ( OTCPK:SSREY ) 2.8509%. That works out to 21.267% of the fund’s top ten holdings and 74.941 of the fund’s total financial holdings. The funds motif carries over to the financials also. They have good dividends, low market volatility and concentrated in the top holdings. UBS is a global investment bank as well as wealth and asset managers with offices in 24 countries and all major financial centers worldwide. UBS carries a dividend yield of 2.53% at $0.53 annually, has a P/E of 16.23 with a beta of 1.02 Zurich Insurance provides retail and corporate insurance coverage across the entire spectrum of insurance products in over 170 countries. Zurich Insurance Group carries a dividend yield of 5.50% which works out to nearly $17.00 at its current $308.00 ADR price, has P/E of 11.78 with a beta of 0.399 Credit Suisse provides investment banking and asset management services for high net worth private clients in 50 countries. Credit Suisse has a dividend yield of 2.72% at $0.7464 annually, has a P/E of 22.80 and a beta of 1.08 Lastly, Swiss Re is a leading global reinsurer in 23 countries. Swiss Re has a dividend yield of 4.70% at $4.25 annually, a P/E of 37 and a market beta of 0.97. It’s important to note that according to the WTO , Switzerland’s commercial service exports, which includes financial and insurance services accounts for $93.421 billion or 2.01% of all global services exports. Industrials comprise 11.53% of the fund with only one representation in the top ten, ABB LTD (NYSE: ABB ). At 4.35% of the fund’s holdings, that accounts for 37.728% of all industrial holdings and 6.07% of the top ten holdings. ABB ‘s main focus is on electrical-mechanical equipment. This includes power transmission equipment, surge protection, motors, generators, transformers and linear controllers. ABB provides services and equipment for renewable energy infrastructure, electric vehicle systems, network management and marine transport. Because of its experience and focus on energy transmission, ABB’s has extraordinary growth potential in emerging markets as well as in some advanced economies whose power transmission infrastructure is in need of upgrading. The company’s annual dividend is 2.60% at $0.59 per share, a trailing P/E of 19.38 and beta of 1.14. Syngenta (NYSE: SYT ) is a global biotechnical agricultural products and seed producer located in 90 countries. The company focuses on sustainability, their motto being, “Bringing Plant Potential to Life” . Syngenta focuses on efficient crop production with higher yields and cost savings. At 3.71%, Syngenta accounts for 42.546% of all Materials holdings and 5.179% of the top ten holdings. Once again a closer look reveals an annual dividend yield of 2.33% at $1.95, a P/E of 24.01 and a market beta of 0.71. Lastly, COMPAGNIE FINANCIERE RICHEMONT ( OTCPK:CFRUY ) , at 3.84% of total holdings is most definitely a Consumer Discretionary company, producing unique ‘quality crafted’ luxury products with global distribution. Some of the more familiar names in the product line are Cartier, Alfred Dunhill, Chloé and Piaget . Richemont comprises 5.36% of top ten holdings and 67.605% of all consumers discretionary in the fund. Simply put, its products target the ‘high-end’ retail market, usually immune to cyclical downturns. The annual dividend yield is 1.03% at $0.847 per share, a somewhat high P/E at 34.74 and a market beta of 1.256. (Source: iShares) The fund is concentrated in its top ten holdings, containing 88.91% of all Health Care, 74.94% of all financials, 85.30% of all consumer staples, 37.728% of all industrials, 42.546% of all materials and 67.605% of all consumers discretionary. Telecommunications, 1.46% of the fund and Energy, 0.80% of the fund do not factor into the top ten holdings. A few other telling statistics of the top ten holdings is the average dividend yield of 2.963%, an average P/E 23.215 and an average beta of 0.8366. Compare this with the average S&P P/E of 21.47 and 1.99% dividend yield. (click to enlarge) (Source: iShares) One caveat: There is a slight currency risk. Switzerland traditionally keeps a strong free float currency and presently its ‘safe haven’ reputation has created demand for its currency and bonds. When a currency weakens against its trading partners, exported products become less expensive. Conversely, if the currency strengthens, exported products become more expensive. The above mentioned Swiss manufacturers had the foresight to utilize a global, material procurement, production and distribution network model, thus avoiding pricing skewed by Swiss Franc currency fluctuations. To be sure, there are other Switzerland focused funds. One of those listed in Seeking Alpha’s ETF hub is the First Trust Switzerland AlphaDEX® Fund (NYSEARCA: FSZ ) . The First Trust’s holdings are heavily weighted towards financials at 32.6% with 14.92% in the top ten. Similarly, 24.07% of the fund’s total holdings are industrials with 11.71% in the top ten. Materials and Consumer discretionary combined, comprise 19.38% of the fund with 7.31% in the top ten. In total, over 76% of total holdings are cyclically sensitive. Essentially, those companies comprising the First Trust Fund are the same companies as in the iShares Swiss focused fund, however the critical feature is the structure of the funds. The weighting of each are nearly inverses of each other. FSZ, by its structure, will have higher cyclical volatility. A second alternative is the Swiss Helvetia Fund (NYSE: SWZ ) . The fund’s website does list the top ten holdings but not the fund’s entire holdings. Judging by the top ten heaviest weighted holdings, SWZ is defensively weighted with healthcare giants Novartis and Roche topping the list followed by consumer staples manufacturer Nestles , followed by the famed Chocolatier Lindt & Spruengli ( OTC:COCXF ). The more cyclically sensitive UBS, Credit Suisse and Swatch group ( OTCPK:SWGAY ) comprise a lesser portion of the top ten holding. It should also be noted that the Helvetia Fund has recently changed its managing advisors. Switzerland has about 50 world class companies so all three funds contain the same companies, more or less. The key is in each fund’s structure. iShares Switzerland focused fund EWL is as carefully crafted as a Swiss timepiece. It weights the best of all worlds: Growth, Dividends and Low Volatility. SWISS ETF Comparison Table 1 month 3 months 1 year 5 years EWL -2.64% 3.81% -2.15% 68.75% FSZ -3.06% 3.84% -5.63% 36.21% SWZ -3.28% 5.56% -17.62% 11.56% (Source: combined) In summary, the iShares MSCI Switzerland Capped ETF ( EWL ) is diversified through globally positioned, cyclically defensive companies and does so without sacrificing growth. All said and done the iShares Switzerland capped ETF is ideal for the investor with a long term view. Editor’s Note: This article discusses one or more securities that do not trade on a major U.S. exchange. Please be aware of the risks associated with these stocks. Disclosure: I/we have no positions in any stocks mentioned, and no plans to initiate any positions within the next 72 hours. (More…) I wrote this article myself, and it expresses my own opinions. I am not receiving compensation for it (other than from Seeking Alpha). I have no business relationship with any company whose stock is mentioned in this article. Additional disclosure: CFDs, spreadbetting and FX can result in losses exceeding your initial deposit. They are not suitable for everyone, so please ensure you understand the risks. Seek independent financial advice if necessary. Nothing in this article should be considered a personal recommendation. It does not account for your personal circumstances or appetite for risk.