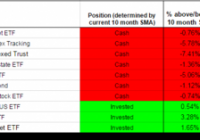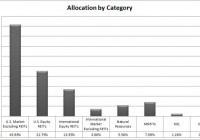
Summary I’ll take readers through a look at my personal portfolio. My biggest individual company weights are still Freeport-McMoRan and Dynex Capital. I’m feeling better about the allocation to DX than to FCX right now, but still holding both. My biggest new investment in June was in equity REIT ETFs. I expect that to be the same for July. Over the next year I also plan to add to my international holdings in SCHF and may buy another mREIT. I expect to sell Renesola to harvest a tax loss this year and will sell FCX (timing uncertain). The other holdings are long term allocations. It’s useful for readers to have a solid disclosure about the investing choices of the analysts they follow. Seeing the choices the analyst has personally made and what plans the analyst has for their future investing choices provides other investors the opportunity to better understand the mindset of the analyst and determine how they feel about the quality of the analyst’s research. Holdings My holdings are: Vanguard Total Stock Market ETF (NYSEARCA: VTI ), Fidelity Spartan Total Market Index Fund Fidelity Advantage Class (MUTF: FSTVX ) Fidelity Spartan Real Estate Index Fund Fidelity Advantage Class (MUTF: FSRVX ) Schwab U.S. REIT ETF (NYSEARCA: SCHH ) Vanguard REIT Index ETF (NYSEARCA: VNQ ) Vanguard Global ex-U.S. Real Estate ETF (NASDAQ: VNQI ) Schwab International Equity ETF (NYSEARCA: SCHF ) Freeport-McMoRan (NYSE: FCX ) Dynex Capital (NYSE: DX ) Renesola (NYSE: SOL ) The categories To avoid getting too much correlation between my assets and ending up with too much risk in my portfolio, I group my investments into categories. As an American, I’m heavily invested in domestic equities and I classify all foreign investments as international. I make one distinction in international markets and that is between international REITs and other international companies. (click to enlarge) Individual Companies / ETFs / Mutual Funds The next chart breaks down the allocations by the actual ticker. Give some feedback in the comment section about the presentation used here. I’d like to know what works and what doesn’t work. I aim to provide readers with a look at my personal holdings once per month. (click to enlarge) Manual Changes While I’m using automatic investments for FSTVX and FSRVX to keep dollar cost averaging into the holdings, I’m also making manual purchases each month. After seeing some substantial weakness in the REIT ETFs, I decided to pump up my allocation on domestic equity REITs. The position in domestic equity REITs provided me with a return around negative 5.5% for the month but my allocation is up from buying more shares. I have access to a fairly solid selection of tax advantaged accounts, so I’m able to buy into these equity REITs without worrying about higher taxes on income from REITs. VTI / FSTVX Both investments offer exposure to the whole U.S. market while having very low expense ratios. I’m using automatic purchases for the Fidelity mutual fund so it will be increasing as a percentage of the holdings. VNQ / FSRVX / SCHH This was my major investment for the month. I suspect that during July it may be my largest investment area again. I might add a small amount to SCHF as well. Adding some mREITs I feel the mREIT market is attractive right now precisely because it appears unattractive. By the time the market clearly turns, many of the major bargains in this sector may be gone. However, I decided it was more important to add funds to my equity REIT holdings because I am concerned about the potential for inflation that could increase rates and hurt the mREITs more than I would expect it to hurt the equity REITs. Since mREITs are one of my major areas of coverage, here is a quick look at my view on several of the companies. In my opinion Dynex Capital, CYS Investments (NYSE: CYS ), American Capital Agency Corp (NASDAQ: AGNC ), and Bimini Capital Management (OTCQB: BMNM ) are attractive investments in the space, though investors consider Bimini should be doing some major due diligence. In my opinion Orchid Island Capital (NYSE: ORC ) and Javelin Mortgage Investment (NYSE: JMI ) are not offering adequate expected returns for the level of risk. Some investors will suggest that ORC and BMNM are the same; I staunchly disagree despite the very strong connection between the two. It is a complex argument and would derail the article, but readers should know I took the stance after significant research. Lack of Bonds I have nothing against bonds, but I don’t care for weak yields or high credit risk. The situation becomes further complicated by quality bond ETFs being much harder to find than quality ETFs for whole market equity or REITs. With the weak yields on bonds currently, I’m just not inclined to spend much time searching for the diamond in the rough. FCX I did quite a bit of research before initiating a position. However, I believed commodity futures pricing would lead stock pricing by at least a few hours. While that has often been the case, I saw FCX move before the futures frequently which gave me no compelling options for timing an exit. I’ve seen the upcoming spin off of oil assets and need to publish some coverage in that regard. All in all, I dislike the mining sector and don’t see the light at the end of the tunnel but I do see the potential for some strength with the change in the capital structure. If that comes to pass, I may take it as an exit opportunity. SOL This is a tax loss holding. That is all. It is also a reminder to never get too cocky, a lesson we should all remember. Thank goodness I bought this in a taxable account so I can at least get some benefit from the terrible investment. Conclusion Most of my portfolio, over 90%, represents holdings I am planning to keep for the long term. I would love to say I learned my lesson on Renesola and will not repeat the mistake, but I expect that I will at some point make another bad call on a penny stock and watch the money evaporate. It is a risk of being willing to invest in the tiny companies, and I that is a risk I expect to take many times in the future. The core of my portfolio will be low fee ETFs to index the market and the individual holdings will often be relatively small companies where I believe there is insufficient coverage for the market to price them correctly in the short term. The equity REIT allocations may seem a bit high, but I view international REITs as being primarily international investments because they have a stronger correlation with other international funds than with domestic equity REITs. My domestic equity REIT allocation may seem a bit high also, but I intend to push it higher as I shove money into my various tax advantaged accounts for the year. Disclosure: I am/we are long VTI, FSTVX, FSRVX, SCHH, VNQ, VNQI, SCHF, FCX, DX, SOL. (More…) I wrote this article myself, and it expresses my own opinions. I am not receiving compensation for it (other than from Seeking Alpha). I have no business relationship with any company whose stock is mentioned in this article. Additional disclosure: Information in this article represents the opinion of the analyst. All statements are represented as opinions, rather than facts, and should not be construed as advice to buy or sell a security. Ratings of “outperform” and “underperform” reflect the analyst’s estimation of a divergence between the market value for a security and the price that would be appropriate given the potential for risks and returns relative to other securities. The analyst does not know your particular objectives for returns or constraints upon investing. All investors are encouraged to do their own research before making any investment decision. Information is regularly obtained from Yahoo Finance, Google Finance, and SEC Database. If Yahoo, Google, or the SEC database contained faulty or old information it could be incorporated into my analysis.