Tag Archives: nreum

Examining Your Fund’s Puerto Rico Exposure

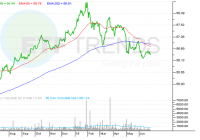
Summary Puerto Rico is scaring investors on fresh default concerns. High-yield municipal bonds are fluctuating on the heightened risks. Focus on three high-yield muni ETFs. By Todd Shriber & Tom Lydon Greece or Puerto Rico, investors have their pick of default poison, but investors in fixed-income, exchange-traded and mutual funds would do well to monitor goings-on in Puerto Rico because the U.S. territory’s imminent default could affect some well-known municipal bond funds. So dire is the situation in Puerto Rico, Gov. Alejandro García Padilla told the New York Times over the weekend that government finances there are “in a death spiral.” And $72 billion is not chump change. To put $72 billion into context with a catchy anecdote, that is more than twice the market capitalization of General Mills (NYSE: GIS ). Puerto Rico’s debt woes are important to fund investors because an “estimated in 2013 that as much of 80% of Puerto Rico’s debt has found its way into muni-bond funds, and 180 mutual funds in the United States and elsewhere have at least 5% of their portfolios in Puerto Rican bonds,” Alan Gomez reports for USA Today , citing Morningstar data. “Last week, the general obligation (GO) debt had plumbed new depths, helping to record a negative 5% month-to-date return for the S&P Municipal Bond Puerto Rico General Obligation Index. According to JR Rieger, global head of fixed income for S&P Dow Jones Indices, the facts are the situation isn’t looking good: the pending Puerto Rico Electric Power Authority July 1st default looms on the market, the possible restructuring of the Government Development Bank debt and the possible postponement of G.O. set – asides have sent alarms to G.O. bond holders,” said S&P Capital IQ in a new research note. The $1.6 billion Market Vectors High-Yield Municipal Index ETF (NYSEARCA: HYD ) lost 1.4% Monday . That ETF has a Puerto Rico weight of just 3.2%, making the territory the fund’s tenth-largest geographic weight. The $396.8 million SPDR Nuveen S&P High Yield Municipal Bond ETF (NYSEARCA: HYMB ) lost just 0.8% yesterday despite a Puerto Rico weight of over 13%, making the territory HYMB’s largest geographic weight. The shorter-duration Market Vectors Short High-Yield Municipal Index ETF (NYSEARCA: SHYD ) was unchanged Monday even with a 4.5% weight Puerto Rican munis. Some actively-managed mutual funds have significantly larger Puerto Rico exposure than the ETF rivals. “Oppenheimer Rochester Fund Municipals (MUTF: RMUNX ), an actively managed mutual fund has 77% of its assets in NY state bonds, but most of the rest of the assets is in Puerto Rico bonds. Similarly Oppenheimer Rochester New Jersey Municipal Fund (MUTF: ONJAX ) has 29% of assets in bonds issued by Puerto Rico, despite what some New Jersey residents might expect,” according to S&P Capital IQ. SPDR Nuveen S&P High-Yield Municipal Bond ETF (click to enlarge) Tom Lydon’s clients own shares of HYD. Disclosure: I am/we are long HYD. (More…) I wrote this article myself, and it expresses my own opinions. I am not receiving compensation for it. I have no business relationship with any company whose stock is mentioned in this article.

Feeling Unfulfilled By The Volatility Tease?

Summary Futures touched backwardation a couple times this week. Investors should realize their risk/reward before jumping head first into the shallow end of the pool. Markets appear to be normalizing mid-week. Feeling unfulfilled by the volatility tease? You’re not alone. Monday was the big headline this week with the market going gaga for Greece. By mid-week volatility ETPs had given up some of their gains but remained elevated. In this ultra-low volatility environment investors forget that the historical mean for the VIX is around 17. By simply reverting to the mean, the ProShares Ultra VIX Short-Term Futures ETF (NYSEARCA: UVXY ) managed to gain an impressive 40%+ at its peak on Tuesday. However, the pundits were out on Monday already saying to short volatility. I would just question the insight behind such as suggestion. Had you waited until Tuesday, you would have had a better opportunity. These types of one day scenarios are really a volatility trader’s best friend. The markets knew this was coming and still overacted. Economic data out of the U.S. continues to be good and if you have followed my past articles, I have always recommended looking to economics to guide your VIX trading. I continue to seek events that cause over 5-10% backwardation as the optimal risk vs. reward scenario. With that being said I did sell a couple UVXY calls on Tuesday. However, I really wanted this to turn into something more but it appears the market has other plans. Every tick the market took higher really just made me more angry. Can we please just get a good freak out already? In this article I will review the basics of UVXY and go over what I am watching for during the next few months. UVXY (click to enlarge) VIX futures did dip into slight backwardation during the week. (click to enlarge) If you are unfamiliar with volatility products, UVXY will gain premium when futures are in backwardation similar to how the ProShares Short VIX Short-Term Futures ETF (NYSEARCA: SVXY ) benefits from contango. For more information on these two terms, click here . UVXY invests in front and second month VIX futures contracts and will rise when futures rise. Ultimately it will lose value over time, which is why my strategy is to wait for a spike and then enter into short positions through options. It had been just shy of five months since backwardation presented itself. Outlook What this spike in volatility should have showed volatility investors is that market complacency is beginning to wear off. Monday was nothing more than a trigger happy reaction to news that had already been expected to happen. Given the positive economic data, I fully expect liftoff of rates in the September Fed meeting. Any slowdown in growth that coincides with rising rates could trigger another knee jerk reaction from the market. Even though we are in the expansion phase of the business cycle, in my opinion this market will tread water and possibly move slightly higher. If you look at the S&P action this year gains have been minimal and so has volatility. This has been despite record margin debt and record share buybacks from companies. Even more concerning to me is that some of these buybacks are built on margin! Companies will eventually have to repay that debt. What will be left to support earnings growth? Earnings growth is the bedrock of stock market appreciation. We will see an increase in EPS from buybacks but the higher stock prices go, the less effective buybacks become. It has been very quiet on the political front for a long time. Certainly there are angry countries out there preparing to go to war or not pay their debts? Although these things are poor for humanity they make for good volatility investment opportunities. Conclusion It was refreshing to finally have a down day in the market and see UVXY spike. However, traders should not instantly jump on these types of scenarios but rather let it play out a little to make sure you are making the right decision. I am looking forward to a much more volatile end of the year. October is the best month for volatility when looking at seasonality. You have the Feds on deck in September. Too bad the government isn’t shutting down this year. That sure was fun and profitable. Eventually the market will have several tragedies coincide with one another and it will make for a more profitable opportunity to short volatility. Those that entered trades this week, best of luck and remember to manage your risk. I am still at 80% in cash just waiting for a better opportunity in the VIX futures market. My retirement portfolio is performing well with my Citi (NYSE: C ) recommendation but suffered from my Micron (NASDAQ: MU ) purchase before earnings. I was able to cut losses after earnings but my performance for the year resembles that of the S&P 500. Sometimes you just need to be able to look back and realize you made mistakes and move on. Going all in on a little spike in volatility may be profitable a couple times but it will eventually come to bite you. Patience is key, especially in this market environment. I understand that you have to take what you can get, but always remember that capital preservation is your number one priority. Best of luck to you in the coming months! I look forward to getting back to volatility analysis. For free real time updates you can follow me here on Seeking Alpha and on Twitter. Often times during these events I only have time to write an Instablog, due to editing times. If you aren’t a real time follower it will not notify you of Instablog posts. Disclosure: I am/we are short UVXY. (More…) I wrote this article myself, and it expresses my own opinions. I am not receiving compensation for it (other than from Seeking Alpha). I have no business relationship with any company whose stock is mentioned in this article. Additional disclosure: Only a couple calls short on UVXY

June AAII Asset Allocation Survey: Cash Levels Continue To Rise

Stock and stock fund allocations declined but remain above their historical average for the 27th month in a row. Bond, bond fund and cash allocations only showed minor changes this month. Of alternative investments held by members, real estate is represented the most. The June AAII Asset Allocation Survey reveals that individual investors increased their cash allocations for the third consecutive month. The rise in cash levels occurred as equity allocations fell to their lowest level since January. Stock and stock fund allocations declined 0.5 percentage points to 67.2%. June tied January for having the smallest allocation to equities in 2015. Nonetheless, stock and stock fund allocations remained above their historical average of 60% for the 27th consecutive month. Bond and bond fund allocations were unchanged at 15.5%. Technically bond fund allocations declined and bond allocations rose, but the changes were very minor. June was the second consecutive month with fixed-income allocations below their historical average of 16.0%. Cash allocations edged up 0.5%, to 17.3%. This third consecutive monthly increase kept cash allocations at their highest level since October 2014 (18.7%). The increase was not large enough to keep cash allocations from being below their historical average of 24% for the 43rd consecutive month, however. The rising level of cash corresponds with trends we’ve been seeing in our weekly Sentiment Survey. Neutral sentiment has been at an unusually high level for 12 consecutive weeks. Neutral sentiment’s record streak of consecutive weekly readings at or above 45% for 10 consecutive weeks lasted through much of last month. At the same time, many individual investors continue to be frustrated by the ongoing low-interest-rate environment. June’s special question asked AAII members if any portion of their portfolio is allocated to alternative investments (something we do not track in our monthly survey). Almost half of all respondents (49%) said no, they do not hold any alternative investments. Some said they have no interest in owning them, while others suggested they needed to learn more about these types of investments before deciding to allocate to them. A small group of members asked us to define what counts as an alternative investment. Slightly more than a third (35%) said they own alternative investments. Many described their allocations to “alts” as accounting for 10% or less of their total portfolio. Real estate was most common, with 15% of all respondents saying they had exposure to it either through real estate investment trusts (REITs) or via a direct ownership. One member has ownership in a vineyard. Here is a sampling of the responses: “I do not and will not consider ‘alternative investments.'” “No, because I do not have enough information about ‘alternative investments’ for evaluation.” “Not much…I tried silver, gold, stamps, and convertible bonds; no returns are as good as stocks.” “Yes, about 8% to 10% of my portfolio is in ‘alternative investments.'” Note: A spreadsheet error led to incorrect data being sent out in last month’s press release. The correct numbers for May’s Asset Allocation Survey were as follows: stocks and stock funds: 67.7% (down 0.2 percentage points), bonds and bond funds: 15.5% (down 0.7 percentage points) and cash: 16.9% (up 1.0%). June AAII Asset Allocation Survey results: Stocks and Stock Funds: 67.2%, down 0. 5 percentage points Bonds and Bond Funds: 15.5%, unchanged Cash: 17.3%, up 0.5 percentage points June AAII Asset Allocation Survey details: Stock Funds: 33.5%, down 1.1 percentage points Stocks: 33.6%, up 0.6 percentage points Bond Funds: 11.8%, down 0.1 percentage points Bonds: 3.8%, up 0.1 percentage points Historical Averages: Stocks/Stock Funds: 60% Bonds/Bond Funds: 16% Cash: 24% *The numbers are rounded and may not add up to 100%. The AAII Asset Allocation Survey has been conducted monthly since November 1987 and asks AAII members what percentage of their portfolios are allocated to stocks, stock funds, bonds, bond funds and cash. The survey and its results are available online here . Disclosure: I/we have no positions in any stocks mentioned, and no plans to initiate any positions within the next 72 hours. (More…) I wrote this article myself, and it expresses my own opinions. I am not receiving compensation for it. I have no business relationship with any company whose stock is mentioned in this article.