Tag Archives: nreum

VQTS: A Large Cap Investment That Protects Itself

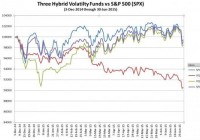
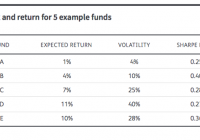
In my opinion the UBS ETRACS S&P 500 VEQTOR Switch ETN ( VQTS) is the best exchange traded product for solving the essential conundrum of the stock market: how to run with the bulls without getting eaten by the bears. The algorithms in VQTS are tuned to outperform the other hybrid volatility funds like the Barclays ETN+ VEQTOR S&P 500 Linked ETN ( VQT) and the VelocityShares Volatility Hedged Large Cap ETF ( SPXH) during good times and to be competitive during the bad times. We don’t have much trade data since UBS only introduced VQTS on December 3rd, 2014. It stumbled in its first month of trading, but then recovered during the first half of 2015-now lagging SPX by only 0.5% since its inception. All of the hybrid volatility funds dynamically allocate assets into the S&P 500 (SPX), VIX futures, and cash depending on market conditions. VQTS is the first fund of this type that invests all of its assets into the S&P 500 when the market’s overall volatility is low. This avoids the costs of hedging when the market is least likely to go down-during the long upward stretches of bull markets. In comparison, two similar funds, Barclays’ VQT and the PowerShares S&P 500 Downside Hedged Portfolio ETF ( PHDG) both have at least 2.5% of their assets allocated to long volatility-and that small amount significantly drags down their returns during bull markets. The chart below compares the simulated performance of VQTS compared to SPX, VQT, and SPXH from early 2006. VQTS defines low volatility as being historical volatility less than 10% using the higher of two exponentially weighted moving averages on volatility. If realized volatility climbs above 20% VQTS starts holding cash and volatility securities (2/3rds cash, 1/3rd volatility) in addition to the large cap S&P 500. The table below shows the range of asset allocations as realized volatility increases. VQTS Asset Allocations Realized Volatility (exponentially weighted) Equity % Volatility % Cash % 0% to 10% 100% 0% 0% 10% to 20% 90% to 80% 3.3% to 6.7% 6.7% to 13.3% 20% to 30% 80% to 70% 6.7% to 10% 13.3% to 20% 30% to 40% 70% to 60% 10% to 13.3% 20% to 26.7% 40% to 50% 60% to 50% 13.3% to 16.7% 26.7% to 33.3% 50% to 60% 50% to 40% 16.7% to 20% 33.3% to 40% 60% to 70% 40% to 30% 20% to 23.3% 40% to 46.6% 70% to 80% 30% to 20% 23.3% to 26.7% 46.6% to 53.3% 80% to 90% 20% to 10% 26.7% to 30.0% 53.3% to 60% In October 2008 the realized volatility as computed by VQTS’ algorithms peaked at 82% When not fully allocated to equities VQTS takes a long or short position in VIX futures depending on the curvature of the futures’ term structure. The term structure is the curve that’s formed if you plot VIX futures’ price vs time to expiration. The decision to go long or short is determined by the comparison between the slope of the two nearest to expiration futures (1st and 2nd) and the slope of the 4th and 7th month futures. I’ve marked up the chart below from vixcentral.com to illustrate the calculation. VQTS’ curvature calculation is similar, but not identical to the more familiar designations of contango and backwardation for futures’ term structures. In general VQTS will go long volatility if the term structure is in backwardation (futures prices less than spot), and short volatility if the curve is in contango. This approach would have worked well in the past, profiting from the fast rise of volatility as a crash / big correction develops, and then switching to be short volatility as volatility mean reverts. The chart below shows the simulated performance of VQTS during the 2008/2009 crash. VQTS experienced around a 20% drawdown in the fall of 2008 before rallying to a year end gain of +13%. Many strategies that backtest well on historical data do not perform well once they go live, but as I noted at the beginning of this post VQTS has already shown that it can approximate the S&P 500 during periods of low volatility-the condition the market is in 75% of the time. VQTS’ drawdowns during crashes and corrections are likely to be significant, but VQTS’ strategy of going long volatility during panicky periods and short volatility during the recovery should continue to work well as a way to power through downturns. VQTS is still a small fund with only $25 million in assets, so investors are hesitant to invest in it, but since the S&P 500 and VIX futures are its underlying securities its liquidity is excellent. Bid/ask spreads have been reasonable-in the 6 to 7 cent range (0.3%). Over time I expect its assets to grow into the $500 million range of its closest competitors, VQT and PHDG. Everyone knows this bull market will end, the tough part is guessing when. With VQTS you can ride the bull and be prepared for the inevitable bad ending. Disclosure: None

Why The Best-Performing ETF Isn’t Always The Best Choice

By Andy Rachleff We get a lot of questions about why we choose certain exchange-traded funds in our portfolios and not others. Often, readers of our blog will point out that this or that ETF has outperformed one of the ETFs we recommend for our portfolios. We love getting feedback, but in this case, our readers are failing to see the forest for the trees. Specifically, they’re evaluating things in isolation, when what matters is how a particular ETF works in a portfolio. Sports fans know this idea well. Teams will sign players with superstar statistics, only to see their overall team performance suffer, as the player doesn’t mesh well with others. Conversely, teams may add role players, only to see their team overall performance soar. The same is true in portfolios: What matters is not just the returns of an individual ETF, but its relationship to the other funds in the portfolio. When Is A Hot Performing Fund A Bad Idea? When you construct a portfolio using Modern Portfolio Theory, you’re required to estimate three things: The expected returns of each asset class in the portfolio. The expected volatility of each asset class in the portfolio. The correlations between each asset class in the portfolio. Let’s imagine you have two portfolios, each of which owns 4 funds. Portfolio 1 holds funds A, B, C and D, while Portfolio 2 holds funds A, B, C and E. Over a one-year time period, we expect to see the following returns and volatility for each fund. (click to enlarge) As a stand-alone investment for a risk-tolerant investor, fund D appears very attractive: It has the highest expected return. But you also have to consider volatility and correlations when determining which ETFs will maximize the risk adjusted return for the overall portfolio. In this case fund D is reasonably correlated to the other funds, whereas fund E is entirely uncorrelated. It marches to its own drummer. (click to enlarge) If you run these portfolios through an optimizer, it will spit out the mix of assets that maximizes the portfolio’s return for every level of risk/volatility. The graph below displays the expected return at every level of risk for three different portfolios: One with just funds A, B and C (red line), one with A, B, C and Fund D (green line) and one with A, B, C and Fund E (blue line). In every case, the portfolio containing Fund E delivers more return per unit of risk than the competing portfolios – despite the fact that Fund D has a higher expected return than Fund E. (click to enlarge) The only case that can be made for the portfolio containing fund D is for investors that are extraordinarily risk-tolerant and searching out the highest absolute return. But even portfolios that are nearly 100% concentrated in fund D barely outperform our A/B/C/E portfolio (and certainly fail on a risk-adjusted basis). At Wealthfront, we evaluate ETFs in the context of their position in a portfolio. That places extra emphasis on funds with low correlations to other funds, and funds that can deliver consistent strong risk-adjusted returns. In a future post, we’ll discuss why we generally favor Vanguard ETFs over their competitors. But even with our overall predilection for Vanguard products, the important thing is the same: All selections must be made in the context of an overall portfolio. Even if that means you leave a hot-performer by the wayside. Disclosure The information provided here is for educational purposes only. Nothing in this article should be construed as a tax advice, solicitation or offer, or recommendation, to buy or sell any security. There is a potential for loss as well as gain. Actual investors on Wealthfront may experience different results from the results shown. Past performance is no guarantee of future results. Andy is Wealthfront’s co-founder and its first CEO. He is now serving as Chairman of Wealthfront’s board and company Ambassador. A co-founder and former General Partner of venture capital firm Benchmark Capital, Andy is on the faculty of the Stanford Graduate School of Business, where he teaches a variety of courses on technology entrepreneurship. He also serves on the Board of Trustees of the University of Pennsylvania and is the Vice Chairman of their endowment investment committee. Andy earned his BS from the University of Pennsylvania and his M.B.A. from Stanford Graduate School of Business.

USAGX: An Underwhelming Fund Covering An Ugly Sector

Summary USAGX offers investors a 1.24% expense ratio to go with a very undesirable batch of companies. The fund holds only 55 companies so investors seeking to diversify can get enough diversification without the mutual fund. The mining industry (including precious metals) is currently in a terribly bearish cycle because of the industry dynamics. Individual companies are choosing to expand production to lower average cost per unit. Expanded production is driving global supply higher and prices lower. One of my picks for least attractive investment is the USAA Precious Metals and Minerals Fund No Load (MUTF: USAGX ). This isn’t a slam on USAA; I believe their banking services and insurance products are excellent. Unfortunately, this mutual fund doesn’t resemble the rest of the sponsor’s company. Terrible Sector The first issue with USAGX is that it is simply positioned in a terrible sector. The mutual fund is investing heavily in mining companies and precious metals which has been a very ugly sector for years. To be fair, I have one mining company in my portfolio and it is a trading investment, not a long term holding. The mutual fund suffers from a few things but one major factor impacting returns has been that mining sector has been terrible. I regularly tell investors to ensure their holdings are adequately diversified, but I can’t bring that same argument to the mining sector. The problem with the mining sector is that the status quo is destroying the industry. Major mining companies are working desperately to expand production as prices crash seeking safety through having lower average costs of production than their competitors. The primary method for reducing their costs is to constantly drive their volume upwards which allows the fixed costs to be spread over a larger volume of production. In a vacuum, that strategy would make perfect sense. Under perfect competition we assume that companies are unable to produce enough of any commodity or product to influence the market price. In reality, we see that this competitive cycle has resulted in too much capacity being built and more being on the way. The only way to get a real broad based recovery for the entire sector, the kind of recovery that would be great for diversified investors, would be for the industry to see dramatically lower levels of competition. Since the biggest companies have been very clear about their intentions to continue driving up capacity rather than worry about the state of the industry, the most likely scenario for capacity to go offline is for smaller firms to fail. Holding a diversified portfolio means holding companies that will go bankrupt as well those that will survive. Diversified with Cost To be fair, it is possible that the investments within USAGX will be picked carefully to avoid holding the ones that will go bankrupt. That is a viable argument, for using an actively managed fund over a passive fund. However, there isn’t a great deal of turnover in the portfolio. The last reported statistic for portfolio turnover showed only 10%. Despite the relatively low turnover, the expense ratio is a mind blowing 1.24%. This is remarkably better than the category average of 1.5%, but this is really a sign to investors that creating a mutual fund for this sector may be a profitable investment. Except it is not that Diversified Despite the high expense ratio, the mutual fund isn’t actually that diversified even within the mining sector. The fund holds only 55 companies and is focused on precious metals rather than being spread across all metals. Easier to replicate For investors that want exposure to the holdings, they may want to seriously consider buying the individual companies or using one of the services that will assist the investor in investing in their own customized fund. For instance, Motif offers investors the ability to create their own custom investment and buy shares in it. Motif would limit those investors to 30 stocks in their customized investment, but the difference from a diversification standpoint between 30 stocks in one sector and 55 stocks in the same sector is not that large. I like broad market ETFs that investing in several segments of the economy for diversification. I also like expense ratios under .10%. If an investor is willing to eat substantial annual costs, they would be better off dealing with the trading fees than paying the expense ratios to use mutual funds for this sector. Holdings The chart below shows the top ten holdings of USAGX. (click to enlarge) Precisely as described, the holdings are focused on mining precious metals. I have no problem with the individual holdings as companies, but I find the industry very unattractive because excessive competition is driving down prices, which in turn is hurting margins, and each individual company is aiming to fix the problem for themselves by creating more the commodity. When the behaviors are looked at individually, they make perfect sense. When they are seen collectively, this is the tragedy of the commons playing out on a global level. Conclusion The only thing I can find to like about the mutual fund is the lack of a load fee. Overall, I see inefficient segment of the market where the mutual funds are offering investors terrible returns and sponsors high income from expense ratios. Investors confident that they should invest in this sector would be better off doing the due diligence on each company they want to buy rather than buying a group of companies that are rapidly working to destroy each other and accidentally destroying themselves in the process. Disclosure: I/we have no positions in any stocks mentioned, and no plans to initiate any positions within the next 72 hours. (More…) I wrote this article myself, and it expresses my own opinions. I am not receiving compensation for it (other than from Seeking Alpha). I have no business relationship with any company whose stock is mentioned in this article. Additional disclosure: Information in this article represents the opinion of the analyst. All statements are represented as opinions, rather than facts, and should not be construed as advice to buy or sell a security. Ratings of “outperform” and “underperform” reflect the analyst’s estimation of a divergence between the market value for a security and the price that would be appropriate given the potential for risks and returns relative to other securities. The analyst does not know your particular objectives for returns or constraints upon investing. All investors are encouraged to do their own research before making any investment decision. Information is regularly obtained from Yahoo Finance, Google Finance, and SEC Database. If Yahoo, Google, or the SEC database contained faulty or old information it could be incorporated into my analysis.