Tag Archives: nreum

UIL Holdings: Regulator Opposition Threatens An Attractive Proposed Merger

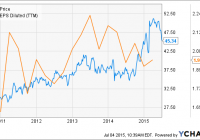
Summary The share price of electric and natural gas utility holding company UIL Holdings reached an all-time high earlier this year following a proposed merger with international utility Iberdrola. The merger would have been good for UIL Holdings, as the company lacks clear earnings growth potential in the face of slow customer expansion and cheap petroleum prices. The company’s shares are not undervalued in the event that the merger fails, while a revised merger price is likely to be lower than the original one. Potential investors looking for utilities investments will find more attractive options elsewhere in the sector at this time. Electric and natural gas utility holding company UIL Holdings (NYSE: UIL ) saw its share price tumble last week after regulators in Connecticut issued a draft decision rejecting its proposed merger with the U.S. subsidiary of European utility Iberdrola (OTCPK: IBDSF ). While the final regulatory decision isn’t due for another two weeks, the market is no longer optimistic that the merger will result in a transaction price above $50 for UIL Holdings’ shares, assuming it happens at all. Despite the recent decline, however, the company’s share price valuations remain well above their pre-2015 ranges despite the presence of a multi-year declining trend to earnings (see figure). This article evaluates UIL Holdings as a potential investment in light of these recent events. UIL data by YCharts UIL Holdings at a glance UIL Holdings is a Connecticut-based diversified regulated energy delivery utility that operates in its home state and west Massachusetts. The holding company, which was formed in 2000 and sold its non-utility segments in 2006, has a total of 727,000 natural gas and electric utility customers. These customers are served via the company’s four utility subsidiaries: United Illuminating Co. [UI], Connecticut Natural Gas [CNG], Southern Connecticut Gas [SCG], and Berkshire Gas [BG]. UI distributes electricity to 325,000 customers in Connecticut and has recently invested heavily in expanding and reinforcing its service area via the construction of new transmission lines. The subsidiary sold its electricity generation assets in 2000 and is focused entirely on delivery and related services. CNG distributes natural gas to 165,000 customers in Connecticut and is expanding into the development and implementation of distributed generation technology. Distributed generation, which allows larger customers to use natural gas as a backup to on-site intermittent sources of electricity such as wind and solar power, is becoming increasingly popular on the eastern seaboard. SCG is also a natural gas distribution utility that was purchased in 2010 from Iberdrola and now has 185,000 customers around the Long Island Sound shoreline. Both SCG and CNG own LNG storage facilities in addition to their natural gas network. Finally, BG distributes natural gas to 36,000 customers in the western half of Massachusetts. UIL Holdings saw its share price and earnings both peak in early 2013 and the former proceeded to underperform the broader sector for the next two years (see figure). Unlike many of its peers, the company was caught relatively flat-footed by the shale gas revolution despite its proximity to the Marcellus Shale, from which it currently sources 73% of the natural gas that it distributes. Its LNG storage facilities were quickly rendered less useful as an expected inflow of seaborne LNG was replaced by abundant domestic natural gas. Furthermore, Connecticut, which is home to the large majority of the company’s consolidated customer base, did not see its economy recover from the effects of the Great Recession as quickly as the U.S. average in 2013 and 2014, causing its earnings growth trend to reverse. Its dividend has in turn remained unchanged in nominal terms since Q1 2009, meaning that it has declined by 10% in real terms over the same period relative to inflation. UIL Holding’s primary means of customer growth in recent years has been by convincing existing homes to convert from heating oil to natural gas. While this effort allowed it to add 16,266 customers last year, the sharp fall in the price of petroleum that occurred in that same year means that the company now expects to add only 12,000 new customers this year. It remains reliant on natural gas, the operations of which generated 67% of its consolidated revenue and more than half of its consolidated net income in FY 2014. UIL data by YCharts Recognizing that earnings growth would only resume via an expanded service area, UIL Holdings began in 2014 to explore mergers and acquisitions. In March of that year it agreed to purchase the operations of Philadelphia Gas Works , the country’s largest municipally-owned natural gas utility, for $1.9 billion. While the deal would have provided the municipality with much-needed cash and expanded the company’s consolidated customer based to 1.2 million across three states, the deal fell apart in December following opposition from labor and the Philadelphia city council, both of which believed that the sale price was insufficient. The market clearly thought otherwise, however, as UIL Holdings’ share price resumed its upward trend and set a new all-time high shortly thereafter. This upward trend was provided with a further boost after Iberdrola announced in February 2015 that it had agreed to acquire UIL Holdings for roughly $3 billion, or an average share price of $52.83. The latter’s share price promptly moved above $50 on the news. The merger was presented as a boon to both companies, allowing Iberdrola to expand its U.S. presence and providing UIL Holdings with 2.4 million new customers in two states and access to 6.3 GW of renewable generation capacity, primarily in the form of wind farms. The two sides were unable to convince Connecticut regulators of the deal’s merits, however, and they rejected the proposed merger last week on the dual grounds that UIL Holdings had not provided it with sufficient evidence that its existing customers would benefit under the deal, or that sufficient corporate safeguards would be implemented. While a final decision is not expected until the middle of July, the regulators also rejected a request by UIL Holdings to give it an additional two months to revise its merger application, stating that this would not be a sufficiently-long period of time in which to do so. The regulators instead encouraged the two companies to start their application over again if they want to move forward with the merger. While a subsequent statement by UIL Holdings’ CEO was ambiguous regarding the path forward, it should be noted that the merger would not have been completed until the end of 2015 had regulatory approval been attained, so this roadblock will delay a potential acquisition by another year in the event that the application is restarted. Furthermore, Iberdrola’s revised purchase price will likely be lower than before in the event that it presses on to reflect the higher regulatory costs that a successful acquisition will entail. Q1 earnings report UIL Holdings reported its Q1 earnings in late April and missed on both lines despite the presence of favorable weather conditions during the quarter. Revenue came in at $584.1 million, missing the consensus estimate by $39.8 million despite increasing YoY by 2.3% (see table). The presence of low energy prices and slightly reduced normalized customer demand was slightly offset by customer growth due to conversions from heating oil to natural gas and harsh winter conditions compared to both the previous Q1 and the long-term average. Gross income rose to $292.7 million from $282.2 million the previous year as customer growth and weather-related demand offset a higher cost of revenue. Operating income fell YoY, however, from $104.4 million to $100.1 million. As with other utilities, UIL Holdings incorporated updated mortality tables reflecting longer life expectancies into its pension costs, which rose as a result. UIL Holdings Financials (non-adjusted) Q1 2015 Q4 2014 Q3 2014 Q2 2014 Q1 2014 Revenue ($MM) 584.1 433.0 293.0 334.8 571.2 Gross income ($MM) 292.7 257.0 198.4 206.5 282.2 Net income ($MM) 57.6 32.3 12.5 9.3 55.5 Diluted EPS ($) 1.01 0.56 0.22 0.16 0.97 EBITDA ($MM) 151.3 123.4 76.1 73.0 146.2 Source: Morningstar (2015). Net income rose slightly YoY from $55.5 million to $57.6 million, resulting in a non-adjusted EPS of $1.01 versus $0.97. EBITDA also rose slightly compared to the previous year from $146.2 million to $151.3 million. The company incurred non-recurring expenses of $6.2 million during the quarter relating to its Philadelphia Gas Works acquisition attempt, its proposed merger with Iberdrola, and regulatory reserve requirements. Adjusted EPS rose slightly from $1.09 to $1.12 but missed the consensus by $0.07, marking at least its f ourth consecutive underwhelming result. UIL Holding’s natural gas subsidiaries performed well, with their consolidated net income rising by 6% compared to the previous year due to customer conversions and cold temperatures. Consolidated net income from the electric distribution and electric subsidiaries fell by 19% and 24% YoY, respectively, although they were mostly flat on an adjusted basis. Strong overall demand caused the natural gas distribution subsidiaries to generate 67% of the company’s consolidated operating income, up from 63% the previous year. UIL Holdings’ ended the quarter with $80.1 million in cash, down from $137.4 million due in part to its non-recurring M&A-related expenses. Its current ratio remained relatively steady at 1.5, however. Long-term debt fell very slightly to $1.7 billion but was more than offset by an increase to short-term debt. $282 million of the company’s total debt load will mature by the end of FY 2018. While any renewal of this debt can be expected to carry higher interest rates due to expected rate hikes later this year, the company’s balance sheet is in a decent position due to its BBB S&P credit rating and availability of another $400 million under its existing credit facilities. UIL Holdings Balance Sheet (restated) Q1 2015 Q4 2014 Q3 2014 Q2 2014 Q1 2014 Total cash ($MM) 80.1 115.6 102.8 175.6 137.4 Total assets ($MM) 5,128.3 5,111.9 4,857.7 5,098.0 5,130.2 Current liabilities ($MM) 444.7 495.6 357.9 604.2 615.5 Total liabilities ($MM) 3,724.8 3,743.7 3,498.7 3,726.8 3,745.1 Source: Morningstar (2015). Outlook The possible collapse of the merger with Iberdrola weakens UIL Holdings’ outlook by reducing the prospect of future earnings growth. The company’s annual adjusted EPS guidance for FY 2015 of $2.30-$2.50, affirmed during the Q1 earnings call , is unlikely to be negative affected since the merger wasn’t expected to close until the end of the year. If achieved, even the low end of this range would represent a decade high, reversing its recent annual EPS trend. Non-adjusted EPS for the year could actually improve if the merger does not proceed by eliminating additional M&A-related expenses. Earnings growth beyond FY 2015 will become much more difficult to achieve in the absence of the merger, however, especially if petroleum prices continue to remain low, dampening heating oil conversion efforts. The company does have the advantage of achieving strong ROEs, especially when compared to the ROEs allowed by regulators. The aforementioned regulatory reserve was set up in response to concerns that its achieved transmission ROE will exceed the allowed ROE in FY 2015, for example. This advantage is mitigated somewhat by its lack of expansion plans in the absence of the merger, however, since this will limit the company’s ability to convert its high ROEs into earnings growth. Furthermore, natural gas distribution ROEs are not as favorable, with SCG and CNG both being allowed ROEs that are only in the single-digits (many of its peers are allowed distribution ROEs above 10%). This has limited the company’s overall ROE to 8.1% (see figure), well below the industry average of 10%. UIL Return on Equity (NYSE: TTM ) data by YCharts Valuation Analyst estimates for UIL Holdings’ diluted EPS in FY 2015 and FY 2016 have remained flat over the last 90 days, although I would not be surprised to see the latter consensus decline if the proposed merger fails in the wake of the regulators’ draft decision. The FY 2015 consensus has fallen very slightly from $2.41 to $2.40 while the FY 2016 consensus has increased very slightly from $$2.57 to $2.58. Based on the company’s share price at the time of writing of $45.34, it has a trailing P/E ratio of 19.6x and forward ratios for FY 2015 and FY 2016 of 18.9x and 17.6x, respectively. While all three ratios have declined in recent months, they are still above even the tops of their respective 5-year ranges (see figure). Investors should also note that the merger price was ultimately to be approximately 17.5x the company’s expected FY 2016 EPS. The company’s share price is currently trading at a level that is slightly above this valuation despite the recent price decline. While the merger can still move ahead, I believe that a revised offer would ultimately be lower than the previous one to account for higher-than-expected regulatory costs. Taken together, these indicators suggest that the company’s shares are overvalued at this time. UIL PE Ratio ( TTM ) data by YCharts Conclusion UIL Holdings has seen its share price decline substantially from an all-time high in the lead-up to and wake of a draft decision by Connecticut regulators to prevent the company’s proposed merger with Iberdrola. Despite this decline, however, I do not believe that the company’s shares are an attractive investment at this time. The merger would have provided it with the ability to generate future earnings growth resulting from an expanded customer base, access to renewable electricity, and its high achieved transmission ROEs. A strong purchase price was in turn the result of these expected earnings. The regulators’ decision casts this growth potential into doubt, however, and the purchase price will likely be lower even in the event that the two companies resubmit a new merger application. Furthermore, UIL Holdings does not provide the history of either earnings growth or dividend growth that makes some utilities attractive even in the absence of a clear value investment thesis. I recommend that those potential investors looking to gain exposure to natural gas and electric utilities search elsewhere, as the presence of bearish sentiment in the sector has created a number of interesting opportunities. UIL Holdings is not one of those at this time. Disclosure: I/we have no positions in any stocks mentioned, and no plans to initiate any positions within the next 72 hours. (More…) I wrote this article myself, and it expresses my own opinions. I am not receiving compensation for it (other than from Seeking Alpha). I have no business relationship with any company whose stock is mentioned in this article.

The Big Picture

Summary US markets have surged in recent years. But this pattern has happened before. Foreign markets may present big opportunities. This is a shortened version of the latest Euro Pacific Capital’s Global Investor Newsletter . The past four years or so have been extremely frustrating for investors like me who have structured their portfolios around the belief that the current experiments in central bank stimulus, the anti-business drift in Washington, and America’s mediocre economy and unresolved debt issues would push down the value of the dollar, push up commodity prices, and favor assets in economies with relatively low debt levels and higher GDP growth. But since the beginning of 2011, the Dow Jones Industrial Average has rallied 67% while the rest of the world has been largely stuck in the mud. This dominance is reminiscent of the four years from the end of 1996 to the end of 2000, when the Dow rallied 54% while overseas markets languished. Although past performance is no guarantee of future results, a casual look back at how the U.S. out-performance trend played out the last time it had occurred should give investors much to think about. The late 1990s was the original “Goldilocks” era of U.S. economic history, one in which all the inputs seemed to offer investors the best of all possible worlds. The Clinton Administration and the first Republican-controlled Congress in a generation had implemented policies that lowered taxes, eased business conditions, and encouraged business investment. But, more importantly, the Federal Reserve was led by Alan Greenspan, whose efforts to orchestrate smooth sailing on Wall Street led many to dub Mr. Greenspan “The Maestro.” Towards the end of the 1990’s, Greenspan worked hard to insulate the markets from some of the more negative developments in global finance. These included the Asian Debt Crisis of 1997 and the Russian debt default of 1998. But the most telling policy move of the Greenspan Fed in the late 1990’s was its response to the rapid demise of hedge fund Long term Capital Management (LTCM), whose strategy of heavily leveraged arbitrage backfired spectacularly in 1998. Greenspan engineered a $3.6 billion bailout and forced sale of LTCM to a consortium of Wall Street firms. The intervention was an enormous relief to LTCM shareholders but, more importantly, it provided a precedent that the Fed had Wall Street’s back. Not surprisingly, the 1990s became one of the longest sustained bull markets on record. But in the latter part of the decade the markets really started to climb in an unprecedented trajectory. As the bubble began inflating in earnest Greenspan was reluctant to follow the dictum that the Fed’s job was to remove the punch bowl before the party got out of hand. Instead he argued that the Fed shouldn’t prevent bubbles from forming, but simply to clean up the mess after they burst. But while U.S. markets were taking off, the rest of the world was languishing, or worse: (click to enlarge) Created by EPC using data from Bloomberg All returns are currency-adjusted But then a very funny thing happened. In March 2000, the music stopped and the dotcom bubble finally burst, sending the Nasdaq down nearly 50% by the end of the year, and a staggering 70% by September 2001. When investors got back into the market their values had changed. They now favored low valuations, real revenue growth, understandable business models, high dividends, and low debt. They came to find those features in the non-dollar investments that they had been avoiding. Over the seven years that began at the end of 2000 and lasted until the end of 2007 the S&P 500 inched upwards by just 11%, for an average annual return of only 1.6%. But over that time frame the world index (which includes everything except the U.S.) was up 72%. The emerging markets, which had suffered the most during the four prior years, were up a staggering 273%. See table below: (click to enlarge) Created by EPC using data from Bloomberg All returns are currency-adjusted Not surprisingly, the markets and asset classes that had been decimated by the Asian debt and currency crises, delivered stunning results. South Korea, which was only up 10% in the four years prior, was up 312% from 2001-2007. Brazil, which had fallen by 4%, notched a 407% return, and Indonesia, which had fallen by 50%, skyrocketed by 745%. The period was also a great time for gold and gold stocks. The earlier four years had offered nothing but misery for investors like me who had been convinced that the Greenspan policies would undermine the dollar, shake confidence in fiat currency, and drive investors into gold. Instead, gold fell 26% (to a 20-year low), and shares of gold mining companies fell a stunning 65%. But when the gold market turned in 2001, it turned hard. From 2001 – 2007, the dollar retreated by nearly 18% (FRED, FRB St. Louis), while gold shot up by 206%, and shares of gold miners surged 512%. As it turned out, we weren’t wrong about the impact of the Fed’s easy money, just too early. 2010 – 2014 In recent years, investors who have looked to avoid the dollar and the high-debt developed economies have encountered many of the same frustrations that they encountered in the late 1990s. Foreign markets, energy, commodities and gold have gone nowhere while the dollar and U.S. markets have surged as they did in 1997-2000. (click to enlarge) Created by EPC using data from Bloomberg All returns are currency-adjusted It is said history may not repeat, but it often rhymes. If so, there may be a financial sonnet brewing. There are reasons to believe that relative returns globally will turn around now much as they did back in 2000. Perhaps even more decisively. Just as they had back in the late 1990’s, investors appear to be ignoring flashing red flags. In its Business and Finance Outlook 2015, the Organization for Economic Cooperation and Development (OECD), a body that could not be characterized as a harbinger of doom, highlighted some of the issues that should be concerning the markets. Reuters provides this summary of the report’s conclusions: Encouraged by years of central bank easing, investors are plowing too much cash into unproductive and increasingly speculative investments while shunning businesses building economic growth. There is a growing divergence between investors rushing into ever riskier assets while companies remain too risk-averse to make investments. Investors are rewarding corporate managers focused on share-buybacks, dividends, mergers and acquisitions rather than those CEOS betting on long-term investment in research and development. While these trends have been occurring around the world, they have become most pronounced in the U.S., making valuations disproportionately high relative to other markets. As we mentioned in a prior newsletter , looking at current valuations through a long term lens provides needed perspective. One of the best ways to do that is with the Cyclically-Adjusted-Price-to-Earnings (CAPE) ratio, which is also known as the Shiller Ratio (named after its developer, the Nobel prize-winning economist Robert Shiller).Using 2014 year-end CAPE ratios that average earnings over a trailing 10-year period, the global valuation imbalances become evident: (click to enlarge) As of the end of 2014, the S&P 500 had a CAPE ratio of well over 27, at least 75% higher than the MSCI World Index of around 15. (High valuations are also on evidence in Japan, where similar monetary stimulus programs are underway). On a country by country basis, the U.S. has a CAPE that is at least 40% higher than Canada, 58% higher than Germany, 68% higher than Australia, 90% higher than New Zealand, Finland and Singapore, and well over 100% higher than South Korea and Norway. Yet these markets, despite the strong domestic economic fundamentals that we feel exist, are rarely mentioned as priority investment targets by the mainstream asset management firms. In addition, U.S. stocks currently offer some of the lowest dividend yields to compensate investors for the higher valuations (see chart above). The current estimated 1.87% annual dividend yield for the S&P 500 is far below the current annual dividend yields of Australia, New Zealand, Finland and Norway. If a dramatic shock occurs as it did in 2000, will investors again turn away from high leverage and high valuations to seek more modestly valued investments? Then, as now, we believe those types of assets can more readily be found in non-dollar markets. Another similarity between then and now is the propensity to confuse an asset bubble for genuine economic growth. The dotcom craze of the 1990s painted a false picture of prosperity that was doomed to end badly once market forces corrected for the mal-investments. When that did occur, and stock prices fell sharply, the Fed responded by blowing up an even bigger bubble in real estate. When that larger bubble burst in 2008, the result was not just recession, but the largest financial crisis since the Great Depression. But once again investors have mistaken a bubble for a recovery, only this time the bubble is much larger and the “recovery” much smaller. The middling 2% GDP growth we are currently experiencing is approximately half of what we saw in the late 1990s. In reality, the Fed has prevented market forces from solving acute structural problems while producing the mother of all bubbles in stocks, bonds, and real estate. A return to monetary normalcy is impossible without pricking those bubbles. Soon the markets will be faced with the unpleasant reality that the U.S. economy may now be so addicted to monetary heroine that another round of quantitative easing will be necessary to keep the bubble from deflating. The current rally in U.S. stocks has gone on for nearly four full years without a 10% correction. Given that high asset prices are one of the pillars that support this weak economy, it is likely that the Fed will unleash another round of QE as soon as the market starts to fall in earnest. The realization that the markets are dependent on Fed life support should seal the dollar’s fate. Once the dollar turns, a process that in my opinion began in April of this year, so too should the fortunes of U.S. markets relative to foreign markets. If I am right, we may be about to embark on what could become the single most substantial period of out-performance of foreign verses domestic markets. While the party in the 1990s ended badly, the festivities currently underway may end in outright disaster. The party-goers may not just awaken with hangovers, but with missing teeth, no memories, and Mike Tyson’s tiger in their hotel room. Read the original article at Euro Pacific Capital. Disclosure: I/we have no positions in any stocks mentioned, and no plans to initiate any positions within the next 72 hours. (More…) I wrote this article myself, and it expresses my own opinions. I am not receiving compensation for it. I have no business relationship with any company whose stock is mentioned in this article.

VNQ: Profit From The Improving Middle Class

Summary Vanguard REIT Index ETF is positioned to benefit from legislation that may materially improve income and employment prospects for the middle class. The strategy of making employees “exempt” and working them longer hours to generate less than minimum wage is reducing demand for apartments. If income improves for these employees or if more employees are hired it should result in more competition for apartments and higher rents. The rents should increase faster than costs which will drive growth in FFO and earnings. The Vanguard REIT Index ETF (NYSEARCA: VNQ ) is one of the best investment options for investors seeking risk adjusted returns in a tax advantaged portfolio. The ETF offers low expense ratios and excellent diversification of REIT holdings. I believe it is positioned to deliver great returns over the next several years even if we see some increases in interest rates. One of the potential catalysts for it is a bill that would make it more difficult to exploit “salaried” status to force employees to work at or near minimum wage while being classified as a manager. The pending legislation may stir up some fierce political pandering and positioning. Sorry, I believe politicians refer to it as “debate”. The legislation I’m referring to was referenced in a recently released fact sheet . The bill would significantly expand the number of workers eligible for overtime pay. Nearly five million workers would be covered. What Won’t Quite Happen If nothing else changed and the companies simply paid the overtime that is currently avoided through “salaried” compensation, the simple result would be increases in labor expenses and compressed profit margins. At the same time, I would expect increased levels of sales as more money would go to middle class and lower class workers with a high propensity to consume . In short, the money would go into their pockets and then into the cash register at another establishment. If the legislation is passed intact, with no enormous loopholes, the companies impacted by it will surely work to minimize the impact. Despite their best efforts, I believe the companies would still be forced to either pay out higher wages to the impacted employees or reduce their hours to prevent “paid overtime” which is substantially less desirable for the company than “unpaid overtime”. If hours are reduced by hiring more employees because regular hours are less expense than overtime, the result would be lower levels of unemployment. If a thorough cost analysis showed that savings in other areas such as recruitment and intangible benefits made overtime superior to hiring, then the total pay for the impacted employees might increase significantly. The “Middle Class” Perhaps I’m being generous by using the term “middle class” when the bill will help making as little as $24,000 per year that were being classified as “exempt” and worked for upwards of 50 to 60 hours per week. However, the upper end of the protected class is significantly higher at around $50,000 per year. In lower cost of living areas this is solidly middle class in my opinion. Excellent News An increasing level of employment and income among workers in the middle class and below would be extremely favorable for apartment REITs that are already benefiting from solid rental numbers. With the underwriting process on mortgages being fairly strict since the financial crisis there has been a significant increase in the proportion of Americans that have chosen to rent. There is another hidden market though, the boomerang babies. There are many individuals that for lack of income moved back in with their parents after college. Improving employment prospects and higher pay for positions that were previously classified as “exempt” bode well for the average income in the younger generations. Propensity to Consume With low labor costs I expect corporations to spend a significant portion of earnings on repurchasing stock and paying dividends. Dividends are often reinvested and repurchased stock increases the ownership stake for existing shareholders but fails to put any cash in the hand of the shareholders absent a decision to sell some of the shares. Because these uses of cash do not put cash in the hands of consumers that are eager to spend it on immediate consumption, they are not sources of cash that would drive up rent. On the other hand, an increase in income for the middle class and below would drive up demand for independent housing. By independent, I simply mean housing that is not occupied (and owned) by their parents. Great Cost Structure The costs of the equity REITs should not increase as rapidly as the revenue may increase from higher rents. I believe the apartment REITs will see increases in revenue that are mostly carried down to the bottom line increasing EPS and FFO (funds from operations). For shareholders of the equity REITs this is a bullish development because it means the REITs should be paying higher dividends. This argument is bullish for the entire industry and makes a diversified play on the industry like the Vanguard REIT Index ETF an excellent choice. Other Sectors The Vanguard REIT Index ETF holds other kinds of REITs as well. An investor in the fund gains exposure to a diversified REIT portfolio and while I would favor seeing a larger concentration in apartment REITs the other REITs stand to benefit as well. The sector I like less on this news is the personal storage REIT sector where companies may see lower levels of business as consumers are capable of acquiring more housing and reducing their consumption of storage space. On the other hand, there is a legitimate case that many consumers receiving cash will spend it on junk and need a place to store that junk. If consumers do decide to buy more junk that they don’t need it would be a very bullish development for the equity REITs. I’m sure some people will think that I’m being too harsh when I refer to the purchases as “junk they don’t need”, but how often do you really access the items in storage? If they were used on a frequent basis it wouldn’t make much sense to keep them in storage. Growth in junk is a major factor in the demand for storage space. Conclusion I’m personally holding a substantial position in equity REITs which includes a substantial position in VNQ. With prices having fallen over the last few months I have stepped up my purchases in the sector and made it my major investment area for new funds. Despite my strong allocation to the sector, I would love to see prices fall further. Whenever the shares get cheaper the yield gets better and I’m able to buy more for the same price. Who is scared of weakness in share prices? Not me. I’m currently holding between 22% and 23% of my portfolio in domestic equity REIT investments and raising that percentage each month. Disclosure: I am/we are long VNQ. (More…) I wrote this article myself, and it expresses my own opinions. I am not receiving compensation for it (other than from Seeking Alpha). I have no business relationship with any company whose stock is mentioned in this article. Additional disclosure: Information in this article represents the opinion of the analyst. All statements are represented as opinions, rather than facts, and should not be construed as advice to buy or sell a security. Ratings of “outperform” and “underperform” reflect the analyst’s estimation of a divergence between the market value for a security and the price that would be appropriate given the potential for risks and returns relative to other securities. The analyst does not know your particular objectives for returns or constraints upon investing. All investors are encouraged to do their own research before making any investment decision. Information is regularly obtained from Yahoo Finance, Google Finance, and SEC Database. If Yahoo, Google, or the SEC database contained faulty or old information it could be incorporated into my analysis.