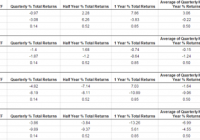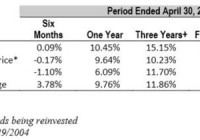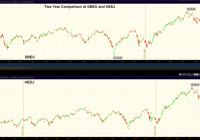
Summary Two well-structured funds but with two different approaches. One is very comprehensive the other selective. One hedges the Euro, the other hedges non-Eurozone currencies as well. The EU is going through some tough times. However, investors should look for potential opportunities rather than avoiding the region altogether. There are two funds which cover all of Europe. The Deutsche X-trackers MSCI Europe Hedged Equity ETF (NYSEARCA: DBEU ) is quite comprehensive with approximately 448 holdings as well as having multiple currency hedges. The second fund is the WisdomTree Europe Hedged Equity ETF (NYSEARCA: HEDJ ) . It is far more selective, holding approximately 134 securities and hedges only the Euro. The WisdomTree fund has been established longer having been incepted 12/31/2009 during the most troubled financial crises years. Deutsche Bank X-Tracker fund is more recently establish, incepted on 10/1/2013. (click to enlarge) The funds allocate sectors differently. For example, WisdomTree allocates its top three sectors, Industrials, Consumer Staples and Consumer Discretionary nearly equally. The Deutsche X-Tracker fund’s most heavily weighted sectors are Financials, followed by nearly equal in Health Care and Consumer Staples. (click to enlarge) The Deutsche X-Tracker fund’s heaviest concentrations are Great Britain, France, Switzerland and Germany while WisdomTree’s distribution is most heavily concentrated in Germany, France, Spain and the Netherlands. (click to enlarge) Five of the X-Tracker top ten holdings are global Health Care giants. They account for just over 43% of the 10 heaviest weighted holdings. On the other hand, the WisdomTree fund is less defensive and more diversified. No single top 10 holding comprises more than 13% of those 10 heaviest weightings. (click to enlarge) Since the funds came to market several years apart, their side by side performance comparison must be broken up into parts. The WisdomTree Hedged Europe Equity fund began trading January 7 of 2010, closing at $47.48. The X-Tracker fund began trading 3 years and 9 months later, October 1 2013 closing at $25.22. HEDJ’s closing price on the first day of DBEU’s trading was $53.80. The first of the two tables below shows HEDJ’s performance from its inception to the day of DBEU’s inception and then HEDJ’s performance over the entire life of the fund. Annualized Returns for HEDJ 1/1/10 through 10/1/2013 From 12/31/2009 to 7/6/2015 Dividend 2.67% 3.35% Stock 3.31% 4.50% Total 5.76% 7.29% The second table compares the two since DBEU’s inception date of 10/1/2013. Annualized from 10/1/13 HEDJ DBEU Dividend 4.82% 6.12% Stock 7.26% 3.27% Total 11.87% 9.27% HEDJ tracks the parent company’s WisdomTree Europe Hedged Equity Index . On the other hand, DBEU tracks Morgan Stanley Capital International MSCI Europe Hedged Equity Index. It’s important to note that both funds are passively managed. Here is a brief comparison of each of the top five holdings by sector weighting as of July 7, 2015. Top 5 Comparison Table WisdomTree HEDJ Top Five Holdings by Weighting X-Trackers DBEU Top Five Holdings by Weightings Anheuser-Busch Inbev (NYSE: BUD ) Consumer Staple P/E 18.68 Price to Cash Flow 12.11 Dividend Yield 2.11% Pay Out Ratio 26.69 Growth 5.07% Fund Percent Holding 5.733% Native Currency Euro Nestle ( OTCPK:NSRGY ) Consumer Staple P/E 15.22 Price to Cash Flow 22.03 Dividend Yield 3.20% Pay Out Ratio 0.00 Growth -0.59 Fund Percent Holding 2.768% Native Currency Swiss Franc Telefonica (NYSE: TEF ) Telecom Services P/E 20.84 Price to Cash Flow 5.18 Dividend Yield 6.52% Pay Out Ratio 0.00 Growth -2.82% Fund Percent Holding 5.517% Native Currency Euro Novartis (NYSE: NVS ) Health Care P/E 22.79 Price to Cash Flow 21.41 Dividend Yield 2.70% Pay Out Ratio 0.00 Growth 1.74 Fund Percent Holding 2.687% Native Currency Swiss Franc Banco Bilbao Vizcaya Argentari (NYSE: BBVA ) Financial P/E 17.37 Price to Cash Flow 11.91 Dividend Yield 4.71% Pay Out Ratio 33.28 Growth -26.32 Fund Percent Holding 5.021% Native Currency Euro Roche Holdings ( OTCQX:RHHBY ) Health Care P/E 24.54 Price to Cash Flow 18.98 Dividend Yield 3.01% Pay Out Ratio 73.94 Growth 1.46 Fund Percent Holding 2.329 Native Currency Swiss Franc Siemens ( OTCPK:SIEGY ) Industrial P/E 12.89 Price to Cash Flow 9.46 Dividend Yield 3.70% Pay Out Ratio 46.28 Growth 2.23% Fund Percent Holding 4.937% Native Currency Euro HSBC (NYSE: HSBC ) Financial P/E 13.23 Price to Cash Flow N/A Dividend Yield 5.65% Pay Out Ratio 58.31 Growth -14.86% Fund Percent Holding 2.035% Native Currency Great British Pound Daimler ( OTCPK:DDAIY ) Consumer Discretionary P/E 11.09 Price to Cash Flow 6.53 Dividend Yield 3.11% Pay Out Ratio 33.19 Growth 10.97% Fund Percent Holding 4.642% Native Currency Euro BP PLC (NYSE: BP ) Energy P/E 44.12 Price to Cash Flow 5.92 Dividend Yield 5.95% Pay Out Ratio 163.64 Growth -16.11% Fund Percent Holding 1.462% Native Currency Great British Pound Data from Reuters; Data TTM unless otherwise indicated It’s interesting to note that all 10 of WisdomTree’s top holdings are headquartered in the Eurozone. On the other hand, only four of X-Tracker’s top ten holdings are headquartered in the Eurozone. Royal-Dutch Shell is headquartered in both London and the Netherlands. The rest are headquartered in non-Eurozone Great Britain or non-EU member Switzerland. According to X-Trackers and WisdomTree, both hedge with forward contracts, although WisdomTree hedges only the Euro. What this implies is that U.S. Dollars invested in the WisdomTree fund may be more exposed to currency fluctuations since 9 of the 28 EU members are not Euro zone countries, although one of the nine, Denmark maintains a very close Euro peg and the Czech Republic maintains a conversion cap. The last comparisons are made of a few average metrics. The top ten holdings of the WisdomTree Fund outperform the X-Tracker fund in every category. However it is important to observe that HEDJ has a higher beta whereas the X-Tracker fund performs virtually with the market. Top Ten Averages P/E Price/Cash Flow Dividend Yield Payout Ratio Growth Beta HEDJ 18.191 10.816 4.085 37.50 2.004 1.295 DBEU 25.219 14.367 3.987 71.732 -3.19 1.044 There are a few ‘outliers’ in each fund, dual-listed companies, for example DBEU holds Investec, headquartered in South Africa and Carnival Cruise headquartered in U.S. Lastly, 81 of the 134 holdings in the WisdomTree fund also are held in the X-Tracker fund; in other words just about 61% of the WisdomTree fund intersects the X-Tracker fund. To sum up each fund covers Europe, though one is far more broad based than the other, although there is some overlap of each fund. The WisdomTree Fund is a more selective fund, whereas the X-Tracker fund is a broad representation of the entire European market. Also, the investor needs to weigh-out the need for currency hedging. Hedging mitigates the risk but does not eliminate it and the hedge might work against the portfolio under some circumstances. The WisdomTree fund hedges only the Euro; the X-Tracker Funds hedges the Euro, Swedish Krona, Great British Pound, Danish Krone, Swiss Franc and Norwegian Krone. The Europeans will not be too quick to give up on their long awaited and hard won economic union. Modern Europe in spite of all its shortcomings has a state-of-the-art infrastructure, an overall advanced economy and culture. More than likely Europe will resolve its current issues as well as those in the future. The question for the investor is how to be properly positioned: through the selective WisdomTree European Hedged Equity Fund or the broader based Deutsche X-Tracker MSCI Europe Hedged Equity ETF? The WisdomTree fund has the potential to outperform the market quicker. However, the higher volatility incurs higher risks. On the other hand, the X-Tracker fund’s volatility matches the market hence minimizes the risk. Either one of the funds will eventually reflect better times. The investor would be wise to at least consider investing in a European fund, but to completely ignore Europe would be foolish. Disclosure: I/we have no positions in any stocks mentioned, and no plans to initiate any positions within the next 72 hours. (More…) I wrote this article myself, and it expresses my own opinions. I am not receiving compensation for it (other than from Seeking Alpha). I have no business relationship with any company whose stock is mentioned in this article. Additional disclosure: CFDs, spread betting and FX can result in losses exceeding your initial deposit. They are not suitable for everyone, so please ensure you understand the risks. Seek independent financial advice if necessary. Nothing in this article should be considered a personal recommendation. It does not account for your personal circumstances or appetite for risk.