Tag Archives: nreum

Global Macro: The Role Of A ‘Go Anywhere’ Strategy

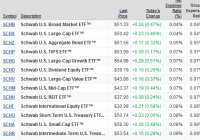
By Andy Hyer Global macro is among the least restricted of all the major investment styles and is often referred to as a ‘go anywhere’ strategy which can potentially create positive investment returns in a wide range of economic environments. As shown in the diagram below, there is a rules-based process that we follow to manage our Global Macro portfolio (available on the Masters and DMA platforms at Wells Fargo Advisors and other SMA platforms , as a mutual fund – Arrow DWA Tactical Fund A (MUTF: DWTFX ) – and as an ETF – Arrow DWA Tactical ETF (NASDAQ: DWAT ). Investment Process We start with a broad investment universe of ETFs from the following asset classes: U.S. Equities, International Equities, Inverse Equities, Currencies, Commodities, Real Estate, and Fixed Income. That broad universe of ETFs is categorized into ETF Baskets, allowing us to rank the baskets by their relative strength. That top-down Basket Ranking part of the model seeks to guide the model to the strongest asset classes and to avoid the weakest asset classes. There is no forecasting in any part of this model-it is purely a trend-following strategy. There is also a bottom-up ranking of all of the ETFs in the investment universe. That ranking allows us to score each ETF to determine exactly what we buy and when a position is sold. 10 ETF are held in the Global Macro portfolio and the positions will stay in the portfolio as long as they retain strong relative strength. We’ve had some positions stay in the portfolio for years at a time and other positions that have been quickly removed. Any position stays in the portfolio only as long as it retains is favorable relative strength. (click to enlarge) Why Global Macro? Asset classes go through bull and bear markets. That goes for all asset classes. It is easy for someone to look at any 30 year period of time in history and use that period to suggest that all that is needed for any investor is a buy and hold approach to asset allocation using a narrow universe of asset classes. In one 30-year period, a 70% allocation to U.S. equities and a 30% allocation to U.S. fixed income would do the trick. However, take a different 30 year stretch and it may make more sense to include a healthy allocation to Real Estate or International Equities or Commodities. The ideal or optimal passive allocation for any 30 year stretch is only evident with the benefit of hindsight. Real investors have no idea what the future will hold. Rather than guess what asset mix might work best as they manage their retirement nest egg, a relative strength-driven Global Macro strategy relies on a strict trend-following approach to adapt to current markets. Investors may like to think that if they guess right and select the right passive asset allocation then their investment experience will be similar to the guy on the bike below (top of the image)…smoothly accumulating and compounding their retirement nest egg as they glide towards their retirement years. However, reality in the financial markets is anything but a smooth ride. Without an adaptive investment strategy as part of their asset allocation many investors will guess wrong and pick the wrong passive asset allocation. Furthermore, investor behavior being what it is, many investors will panic at the wrong times (and unwisely tinker with their asset allocations). Global Macro has the potential to play a soothing role for an investor and has the potential to help investors stay the course with their overall asset allocation. (click to enlarge) Source: @ThinkingIP Current Holdings As of 6/30/15, current holdings in our Global Macro portfolio were as follows: (click to enlarge) Performance We are very proud of the fact that Global Macro has performed well compared to its peer group over time. As shown below, The Arrow DWA Tactical Mutual Fund has outperformed 95% of its peers in the Morningstar Tactical Allocation category over the past 3 and 5 years; outperformed 92% over the past year, and has outperformed 68% of its peers YTD. Fact Sheet Click here for a fact sheet on our Global Macro portfolio. Nothing contained herein should be construed as an offer to sell or the solicitation of an offer to buy any security. This report does not attempt to examine all the facts and circumstances which may be relevant to any company, industry or security mentioned herein. We are not soliciting any action based on this document. It is for the general information of clients of Dorsey, Wright & Associates, LLC (“Dorsey, Wright & Associates”). This document does not constitute a personal recommendation or take into account the particular investment objectives, financial situations, or needs of individual clients. Before acting on any analysis, advice or recommendation in this document, clients should consider whether the security or strategy in question is suitable for their particular circumstances and, if necessary, seek professional advice. The relative strength strategy is NOT a guarantee. There may be times where all investments and strategies are unfavorable and depreciate in value. Relative Strength is a measure of price momentum based on historical price activity. Relative Strength is not predictive and there is no assurance that forecasts based on relative strength can be relied upon. Each investor should carefully consider the investment objectives, risks and expenses of any Exchange-Traded Fund (“ETF”) prior to investing. Before investing in an ETF investors should obtain and carefully read the relevant prospectus and documents the issuer has filed with the SEC. To obtain more complete information about the product the documents are publicly available for free via EDGAR on the SEC website ( http://www.sec.gov ).

ETFs For Your Core Domestic Stocks Portfolio: 3 Worthy Competitors

Summary Every ETF investor needs to consider what holdings will form the very core of their portfolio. For the portion relating to domestic stocks, in a previous article I featured Vanguard’s Total Stock Market ETF. In this article, I will examine two other worthy competitors, and analyze how they stack up against VTI. Every investor desirous of developing an ETF-based portfolio does well to start by selecting a few core holdings. In my view, such holdings should offer great diversification along with a rock-bottom cost structure. In a previous article for Seeking Alpha, I featured the Vanguard Total Stock Market ETF (NYSEARCA: VTI ). I concluded that one should seriously consider VTI as a core holding for the portion of your portfolio devoted to domestic stocks. However, there are several worthy competitors in the marketplace. And, they may be even more worthy if your brokerage offers commission-free trading in these ETFs; particularly if one of your goals is to invest regularly and in small increments. In this article, we will examine two such competitors; the Schwab U.S. Broad Market ETF (NYSEARCA: SCHB ) and the iShares Core S&P Total U.S. Stock Market ETF (NYSEARCA: ITOT ). We will compare their structure, expense ratio and other features against VTI, and see how they stack up. Schwab U.S. Broad Market ETF While the history of Charles Schwab (NYSE: SCHW ) traces back over 40 years, the firm is a fairly recent entrant to the ETF market, really getting into the area in a big way in 2009. However, once it committed, it quickly became a formidable competitor. The firm now sports no less than 13 ETFs featuring an expense ratio of .10% or less, as shown here: Heading the list is SCHB, with a market-leading .04% expense ratio. SCHB is based on the Dow Jones Broad Stock Market Index , which tracks the 2,500 largest publicly traded U.S. companies for which pricing information is readily available. This index is a subset of the Dow Jones U.S. Total Stock Market Index, but excludes companies defined as micro-caps. This index has a median market cap of $1.9 billion. Currently, there are exactly 2,506 stocks in this index. If you look at the informational table I include later in this article, you will note that SCHB only contains 2,020 stocks. The answer to why this is the case actually offers a helpful insight into how ETFs, particularly those with incredibly low expense ratios, are able to function. Here is the explanation given in the SCHB prospectus : Because it may not be possible or practicable to purchase all of the stocks in the index, the Adviser seeks to track the total return of the index by using statistical sampling techniques. These techniques involve investing in a limited number of index securities which, when taken together, are expected to perform similarly to the index as a whole. Look at that phrase “possible or practicable .” In other words, they are explaining that the trading costs involved in attempting to purchase every security in the index would lead to a greater tracking error (or divergence from the index) than their actual practice of sampling the index. In many ways, SCHB mirrors VTI quite closely. As of the date I researched this article, it has a 1.85% distribution yield, against 1.88% for VTI. The weighting of the Top 10 holdings in each fund is also virtually identical. The fund is significantly smaller than VTI, with “only” $5.0 billion in Assets Under Management (AUM) as compared to $55.6 billion for VTI. You will see a small reflection of this in average spread (see definition below) of .03% vs. VTI’s industry-low .01%. This simply reflects the massive daily volume that trades in VTI due to its size. iShares Core S&P Total U.S. Stock Market ETF Our second competitor is from the iShares family of ETFs offered by BlackRock, Inc (NYSE: BLK ). BlackRock is another formidable competitor in the sphere of low-cost ETFs, with 19 ETFs featuring an expense ratio of .10% or less . Several of these are Bond ETFs with specific maturity dates so, for the sake of brevity, I show here the 5 ETFs with an expense ratio of .09% or less: (click to enlarge) ITOT is based on the S&P Composite 1500 Index . This index combines the legendary S&P 500, the S&P MidCap 400, and the S&P SmallCap 600 indexes, and covers some 90% of the total U.S. market capitalization. It covers companies with market capitalization of approximately $350 million or greater, with a median market cap of $3.3 billion. You may recall that SCHB’s median market cap is $1.9 billion, signifying that it contains a larger percentage of small-caps than does ITOT. NOTE: If you are interested in a nice visual representation of the scope of the various indexes, I found a wonderful graphic on the bogleheads website. ITOT has a 1.80% distribution yield, against 1.88% for VTI. The weighting of the Top 10 holdings is slightly more concentrated than VTI, at 15.12% vs. 14.00%. The fund is the smallest of our 3 competitors, with $2.4 billion in Assets Under Management (AUM). As a result, the average spread (see definition below) is .05% compared to .03% for SCHB and .01% for VTI. Key Comparative Information I have prepared the tables below as a quick visual comparative reference to help you evaluate the three ETFs side-by-side. First, some key high-level information: VTI, SCHB, and ITOT: Key Information VTI SCHB ITOT Assets Under Management (AUM) $55.6 Billion $5.0 Billion $2.4 Billion Index Tracked CRSP Total U.S. Market Index Dow Jones Broad Stock Market Index S&P Composite 1500 Index Number of Holdings 3,824 2,020 1,503 Weighting of Top-10 Holdings 14.00% 13.80% 15.12% Distribution Yield 1.88% 1.85% 1.80% Expense Ratio .05% .04% .07% Average Spread .01% .03% .05% Notes on terms that may be unclear: Distribution Yield refers to the ratio of distributions paid by the fund for the past 12 months divided by the Net Asset Value. Average Spread refers to the average price difference between the price buyers were willing to pay and sellers were willing to sell, averaged over the latest 45 days. Next, the sector breakdown: VTI, SCHB, and ITOT: Sector Breakdown VTI SCHB ITOT Financials 18.90% 17.90% 17.47% Technology 16.10% 18.70% 19.01% Health Care 14.00% 14.80% 14.92% Consumer Discretionary 13.80% 13.70% 13.01% Industrials 12.40% 10.50% 10.68% Consumer Staples 9.70% 8.40% 8.92% Energy 7.30% 6.80% 7.26% Utilities 3.00% 3.00% 3.04% Materials 2.80% 3.40% 3.44% Telecommunications 2.00% 2.00% 2.02% Other 0.00% 0.80% 0.23% TOTAL 100.0% 100.0% 100.0% Summary All three ETFs are worthy competitors. If you look at this YTD chart, you will see that VTI has a slight lead, and all three have outperformed the S&P 500. VTI data by YCharts If you look at this 5-year chart as a longer-term comparison, you will see that SCHB actually has a very slight lead over that time span, again with all three outperforming the S&P 500. VTI data by YCharts Setting aside the question of whether you can trade a particular ETF commission-free, here is my rating: VTI : In my mind, it was a very close battle between VTI and SCHB. Certainly, SCHB’s stunning .04% expense ratio is not to be ignored. Further, SCHB has slightly edged out VTI over the past 5 years. However, VTI’s slightly higher distribution ratio, huge size, extremely competitive .05% expense ratio, broader market coverage and recent outperformance nudge it to the #1 spot in my evaluation. SCHB : As I mention, this was a very close call. I think Schwab has done an incredible job putting together a world-class ETF for this category. I find it of no small note that SCHB has slightly edged out VTI over the past 5 years and its low expense ratio will doubtless make it extremely competitive as time moves forward. ITOT : Well, in a comparison of 3, one has to come out third. In this extremely tough head-to-head showdown, ITOT’s smaller size, .07% expense ratio and slight comparative underperformance weigh against it. On the other hand, its slight tilt toward large-caps might lower your risk in the event of a market downturn. I must say, however, that the question of which ETF you can trade commission-free may be the ultimate decider for you. Particularly will this come into play if regular, incremental, investments form a large part of your plan. Happy investing! Disclosure: I am/we are long VTI, ITOT. (More…) I wrote this article myself, and it expresses my own opinions. I am not receiving compensation for it (other than from Seeking Alpha). I have no business relationship with any company whose stock is mentioned in this article. Additional disclosure: I am not a registered investment advisor or broker/dealer. Readers are advised that the material contained herein should be used solely for informational purposes, and to consult with their personal tax or financial advisors as to its applicability to their circumstances. Investing involves risk, including the loss of principal.

HIX: Smaller Distributions And History Suggest A Long Life Ahead

The Western Asset High Income Fund II has been trimming its distributions for years. That’s a problem for income-hungry investors. But distribution cuts and a historically stable NAV suggest HIX will live to fight another day. If you are after a reliable stream of income that can you use to live, don’t buy the Western Asset High Income Fund II (NYSE: HIX ). If you are looking for a decent high-yield fund, however, take a look. Those two statements may seem at odds with each other, but they aren’t. Here’s why… A little more than generic At its core, HIX is a high-yield bond fund. As its name implies, Western Asset Management is calling the shots and, over the long haul, its done a solid job. For example, the fund’s trailing annualized 15-year total return through June based on net asset value, or NAV, is roughly 9.5%. That includes the reinvestment of distributions. Compare that to the Vanguard High Yield Corporate Fund’s (MUTF: VWEHX ) annualized 6.3% over that span and HIX looks like a solid high yield option. To be fair, HIX’s standard deviation over that span was 14 compared to Vanguard’s 8. So HIX achieved the higher return by taking on more risk. So for risk averse investors, a more conservative high-yield fund might be a better choice. But if you can stomach the risk, HIX’s performance has been good over the long term. Part of the reason for the added volatility is that HIX makes use of leverage to enhance returns. Recently leverage stood at around 25% of assets. This works great when rates are low because the fund can easily create a carry trade, borrowing for less than it earns and passing the difference on to shareholders. However, leverage also increases the impact of price movements. That’s a great thing in up markets because it enhances returns, but a bad thing in down markets because losses get exacerbated. The other issue to note at HIX on the risk front is that it has a “strategic” allocation to emerging market debt. It’s only around 8% or so of assets, but emerging market debt can be more volatile than other bonds. On the one hand it provides diversification, on the other it can be a drag when emerging markets are struggling. But, at less than 10% of assets recently, it won’t be the driving force at the fund right now. It’s just something to keep in mind, especially since management has the leeway to increase that exposure to as much as 35% of assets. So, on the whole, HIX is a solid long-term performer for those willing to take on a little more risk. That said, the last year has been pretty rough. For comparison, over the trailing 12 months through June, HIX is down 4.5% or so and Vanguard High Yield Corporate is up around 1.5%. Like so many high-yield funds, energy was a big issue in HIX’s poor showing. Leverage, of course, didn’t help either. The impact of this rough spell is worth noting, however. Between April of 2014 and April of 2015, the fund’s fiscal year ends in April, HIX’s net asset value fell from $9.47 a share to $8.57. More recently it’s stood at around $8.25. That’s clearly the wrong direction. But HIX has been here before. For example, in fiscal 2012 the fund’s NAV declined from $9.57 a share $8.86 only to almost completely recover in fiscal 2013. Based on the fund’s long-term performance, the current downdraft is something that it will likely eventually recover from. The income issue Which brings us to the income issue. The fund’s distribution has been shrinking steadily since 2010 when it was $0.09 a month. Today the distribution rounds to $0.07 a month. Not a huge decline on an absolute basis, but a notable one when looked at percentage wise. I would expect the downward trend to continue, so income focused investors looking to replace a paycheck might want to look elsewhere. But I don’t think the distribution cuts are inherently a bad thing. Rates are at historic lows, so older debt that’s matured (or sold) is replaced with the lower-yielding fare in the current market. Thus, the income the portfolio generates is naturally declining. The distribution cuts are simply a part of that. More importantly, the cuts show that management is willing to take the lumps that come along with larger market shifts to keep the portfolio from self liquidating over time. A lot of closed end funds try to delay cuts until there is no choice but to cut, which often leads to more drastic distribution declines. And if income isn’t your focus, the willingness to slowly trim distributions to protect capital is probably the more preferable option. It’s the income thing So, for investors, I think the biggest issue right now is the income question. If you want a steady distribution, HIX isn’t likely to provide it right now. If you are looking to buy a high-yield fund because you want some exposure to the asset class, however, HIX is worth a look. Management is dealing with a rough patch right now, but it’s done so before successfully and it is willing to trim distributions to ensure that it lives to fight another day. That said, the fund isn’t cheap to own, with an expense ratio of around 1.5%. That’s not outlandishly high, but it is clearly more than you’d pay for an exchange traded fund or an open-end mutual fund. Leverage costs are a part of that. But you’re not likely to find an around 11% yield from a high-yield ETF or open-end fund (noting, of course, that HIX’s distributions are likely to shrink further). And HIX is trading at a discount to NAV of around 8%, which is fairly steep for this fund. In fact, the average was a premium of around 1% over the trailing three years. So, for those looking to trade around premiums and discounts, HIX could be worth a deep dive right now. Just don’t expect the current distribution level to hold. Disclosure: I/we have no positions in any stocks mentioned, and no plans to initiate any positions within the next 72 hours. (More…) I wrote this article myself, and it expresses my own opinions. I am not receiving compensation for it (other than from Seeking Alpha). I have no business relationship with any company whose stock is mentioned in this article.