Tag Archives: nreum

Southern Company: A Stock For Income Investors

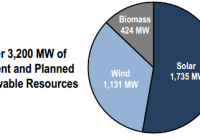
SO has been undertaking correct strategic initiatives by incurring capital spending to develop and strengthen power generation fleet. Company can opt to accelerate its capital spending targeted at renewable power sources. Southern expects to grow its long-term earnings in a range of 3%-4%. Dividend offered by SO stays secure, and the stock is a good investment prospect for income-hunting investors. Utility companies have remained a popular investment choice for income-seeking investors, as utilities offer attractive and solid dividends. In recent times, utility companies have accelerated their capital spending to expand and strengthen regulated operations. Also, utility companies have been scaling down unregulated operations, which will provide stability to their revenue and earnings. Southern Company (NYSE: SO ), which has a solid regulated asset base, stays an impressive investment prospect for long-term income investors, as it offers a solid yield of 5.1% . The company has been undertaking various construction projects and incurring capital investment to strengthen its regulated asset base, which will fuel its rate base and earnings growth in future. However, delays and cost overruns associated with the ongoing construction projects have inflated the company’s risk profile and will limit the upside to the stock price in the near term. The stock is trading at a slight discount to its peers on the basis of forward P/E, which I think is justified given risk delays and cost overruns. Financial Highlights and Stock Price Catalysts The company’s financial performance is backed by its regulated assets base; the company generates more than 90% of its earnings from regulated operations. Southern Company posted a strong performance for 2Q2015; EPS for the quarter came out to be $0.71 , ahead of consensus of $0.69 and the 2Q2014 EPS of $0.68. The performance for the second quarter was supported by rate increases, the strong performance of its subsidiary Southern Power and favorable weather conditions; total weather normalized sales increased by 1%. Also, the company enjoyed weather normalized growth for the second consecutive quarter in all of its three customer segments, including commercial, residential and industrial segments. The company maintained its 2015 EPS guidance range of $2.76-$2.88; however, I think given its strong first half performance, Southern will increase its EPS guidance range for 2015 in October during the 3Q2015 earnings call. The company has been making capital investments to strengthen its power generating fleet; the company plans to make capital spending of more than $16 billion from 2015 through 2017, which will allow its long-term earnings to grow in a range of 3%-4% . In addition, the company has been aggressively working to grow its renewable generation portfolio, and plans to have a renewable generation capacity of almost 3,200MW, including solar, wind and biomass. The company will continue to direct capital spending toward the expanding renewable energy portfolio to take advantage of the 30% solar investment tax credit before the end of 2016. Moreover, given the attractive regulatory environment for renewable capital spending, the company can opt to increase its capital spending for future years, which will positively affect its future earnings growth and the stock price. The following graph reflects the current and planned renewable resources for Southern. Source: Investors Presentation Despite the company’s strong regulated asset base, the ongoing construction of nuclear and coal gasification (IGCC) projects stay a concern for investors. The company’s nuclear project ‘Vogtle’ is on track, and unit 3 and unit 4 are expected to be in operation in 2Q2019 and 2Q2020, respectively; however, substantial construction work remains, and cost overruns and delays will weigh on the stock price. On the other side, the company registered another charge of $14 million for the Kemper project; the project is expected to be completed by 1Q2016. However, delays beyond 1Q2016 are expected to increase the project cost by $20-$30 million every month. Cost overruns and construction delays associated with the ongoing two construction projects have inflated Southern’s risk profile and will limit stock price appreciation in the near term, and the stock return will be dividend driven. The stock trades at a slight discount to peers, which I think is justified given the construction risk attached to the company; Southern is trading at a forward P/E of 15.20x , versus the utility sector’s forward P/E of 16.5x . In my opinion, the stock valuation will not expand and the stock will not trade in-line with its industry P/E multiple until the company’s construction project-related risk decrease or/and its EPS growth accelerates. Separately, the company’s management does not have any plans to issue equity until 2017 to finance its planned capital investments; however, if the company experiences delays and increases in construction costs, the management might revisit their financing assumptions and could consider to issue equity, which will adversely affect its EPS. Summation Southern Company has been undertaking the correct strategic initiatives by incurring capital spending to develop and strengthen its power generation fleet. Going forward, the company can opt to accelerate its capital spending targeted at renewable power sources, which will augur well for its long-term earnings growth; currently, Southern expects to grow its long-term earnings in a range of 3%-4%. Also, dividend offered by the company stays secure, and the stock is a good investment prospect for income-hunting investors, as it offers a yield of 5.1%. However, the construction risk will limit a stock price increase in the near term. Disclosure: I/we have no positions in any stocks mentioned, and no plans to initiate any positions within the next 72 hours. (More…) I wrote this article myself, and it expresses my own opinions. I am not receiving compensation for it (other than from Seeking Alpha). I have no business relationship with any company whose stock is mentioned in this article.

Concentration Consternation

By Chris Bennett “There are 3 kinds of lies: lies, damned lies, and statistics.”- Mark Twain Earlier this week, The Wall Street Journal pointed out that a mere six stocks (Amazon (AMNZ), Google (NASDAQ: GOOG ), Apple (NASDAQ: AAPL ), Facebook (NASDAQ: FB ), Gilead, and Disney) had accounted for more than 100% of the S&P 500’s year-to-date gains. This degree of concentration (reminding some of the peak of the 1990s’ technology bubble) is said to raise “concerns about the health of the market’s advance.” While the article’s arithmetic was correct, its concerns may be misplaced . We don’t have to look back to the tech bubble to see a similar concentration of index returns: During 2011, 4 stocks (Exxon, Apple, IBM, and Pfizer) accounted for more than 100% of the total return of the S&P 500. This did not “presage a pullback,” however, as the S&P 500 followed with 3 straight years of double-digit gains . What was similar about 2011 and 2015 through July 27 (the date of the Journal ‘s analysis)? Aggregate returns were de minimis . In 2011, the S&P 500 gained 2% on a total return basis (and was flat on a price return basis). The total return of the S&P 500 in 2015 was less than 2% through July 27. In both periods, the return of the index was relatively low, making it easy for a small group of strong stocks to account for more than 100% of total performance. Following a few positive trading days, incidentally, “The Only Six Stocks That Matter” now account for only half of the S&P 500’s year to date total return. As of July 29, it would take 22 stocks to account for 100% of the market’s return. Just as the concentration of performance doesn’t lead to reliable conclusions about the market’s future absolute return, it also tells us little about the relative performance of active managers vs. their passive benchmarks. Active managers tend to underperform both when index returns are heavily concentrated among a few stocks and when returns are more widely distributed. In 2011, when four stocks accounted for 100% of the market’s return, 81% of large cap U.S. funds lagged the S&P 500 . 2014 was quite a different year in terms of returns and individual stock contributions to index returns: the S&P 500 ended the year up 14% and it required 176 stocks to account for the market’s total return. Yet active managers did not prosper in these conditions either, as 86% of large cap funds failed to outperform the S&P 500. While it makes for an exciting headline, concentration is no cause for consternation . Disclosure: © S&P Dow Jones Indices LLC 2015. Indexology® is a trademark of S&P Dow Jones Indices LLC (SPDJI). S&P® is a trademark of Standard & Poor’s Financial Services LLC and Dow Jones® is a trademark of Dow Jones Trademark Holdings LLC, and those marks have been licensed to S&P DJI. This material is reproduced with the prior written consent of S&P DJI. For more information on S&P DJI and to see our full disclaimer, visit www.spdji.com/terms-of-use .

Surge In Peabody Adds Gains To Coal ETF: Will It Last?

Yesterday, the black days of coal suddenly brightened up despite downbeat quarterly results from Consol Energy (NYSE: CNX ) and Peabody (NYSE: BTU ). Coal producer Peabody missed on both lines and reduced the guidance. Consol Energy too fell shy of the Zacks Consensus Estimate on both counts. Both companies reported on July 28 before the market opened . Generally, such a situation results in a decline in share price, but these two coal stocks, especially Peabody took the investing world by surprise and showered gains on investors and benefitted the entire coal space and the coal ETF. BTU was up 14.15% in the key trading session of July 28 though it shed 3.3% after hours. CNX added 2.3% yesterday. The duo helped the pure-play coal ETF, Market Vectors Coal ETF (NYSEARCA: KOL ), to fetch a return of 3.3% on July 28. Peabody’s loss of 58 cents per share in second-quarter 2015 was marginally narrower than the Zacks Consensus Estimate of a loss of 59 cents. Peabody had posted a loss of 28 cents in second-quarter 2014. Peabody’s quarterly revenues of $1.34 billion decreased 23.8% year over year and missed the Zacks Consensus Estimate of $1.49 billion by 10.1%. For 2015, the company lowered the total sales target in the range of 225-245 million tons from the earlier-projected range of 235-255 million. On the other hand, diversified fuel producer, CONSOL Energy, reported an adjusted loss of 37 cents per share for the second quarter of 2015. The Zacks Consensus Estimate was earnings of a penny. The company had reported earnings of 7 cents per share in the second quarter of 2014. CONSOL Energy’s quarterly revenues declined 30.8% from the year-ago quarter to $648.9 million. The top line also lagged the Zacks Consensus Estimate of $795 million by 18.4%. What Caused Optimism? Apparently, stock market participants are hunting for the reasons that jazzed up the two stocks. Citigroup analysts argued that even after dividend removal and lackluster results, Peabody is structurally different from its peers due to its approximately $670 million potential of annual cash flow improvement in 2017 from 2015. Such a declaration from a sought-after brokerage house might be the reason for the stock’s outperformance. On the other positive front, Peabody is aggressively implementing cost-saving initiatives, has cut back on production and restructured its organization via lay-offs. The job cut is likely to save $40─$45 million per year. Cost containment efforts are also paying off for the company. Coming to Consol, the rise in shares looks more sensible as the company has been shifting its focus to natural gas from the more struggling coal space. This diversified energy producer is well-placed to cash in on any pickup in commodity prices. ETF Impact While we are not hopeful of the sustainability of this upbeat momentum, as of now the $64 million-coal ETF was the clear beneficiary of this sudden euphoria. Both Consol and Peabody have decent exposures in the coal ETF. Consol takes the fourth spot with 6.05% exposure while Peabody accounts for just 1.2% weight. The 31-stock fund holds a Zacks ETF Rank of #5 (Strong Sell) with a ‘High’ risk outlook. The fund is down over 33% so far this year. Original post . Share this article with a colleague