Tag Archives: nreum

Strong Returns In Up Markets; Protection In Down Markets

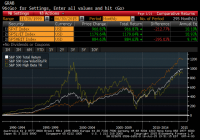
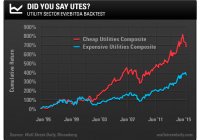
This series offers an expansive look at the Low Volatility Anomaly, or why lower-risk securities have historically produced stronger risk-adjusted returns than higher-risk securities or the broader market. This article shows in simple terms how a Low Volatility strategy would have done in both up and down markets. The downside protection in bear markets more than makes up for lagging returns in bull markets to generate higher risk-adjusted returns over time. Through this expansive series on Low Volatility Investing, I have tried to give readers a theoretical underpinning for why low volatility strategies have produced “alpha” historically while presenting empirical evidence across markets, geographies, and long time intervals. In this article, I am returning to the example of the S&P 500 Low Volatility Index (replicated by SPLV ). This index is comprised of the one-hundred constituents of the S&P 500 (NYSEARCA: SPY ) with the lowest realized volatility over the trailing one year, weighted by the inverse of their volatility, and rebalanced quarterly. As seen in the introductory article to this series and displayed again below, a low volatility factor tilt has produced higher absolute returns than the broader market or its high beta components (NYSEARCA: SPHB ) while producing its namesake lower volatility return profile. Source: Standard and Poor’s; Bloomberg Index information for the Low Volatility and High Beta Indices are back-tested, based on the methodology that was in effect on the launch date of the indices. While the higher risk-adjusted returns inherent in the Low Volatility strategy is visible in this cumulative return series, I though that it would be instructive for Seeking Alpha readers to see the annual returns of the Low Volatility strategy and S&P 500 broken down by up and down years for the broad market gauge. The historical returns of the two indices are tabled on the left. On the right, I have broken these return series into the four down years for the S&P 500 in this sample period and the up years for this broad market gauge. (click to enlarge) In up years for the broad market, the S&P 500 outperformed the S&P Low Volatility Index by 3.9% per year. However, in the down years for the broad market, the S&P 500 Low Volatility Index bested the broader market by 19.6% per year. It is this outperformance in down markets that has led to the long-run higher absolute returns for the S&P Low Volatility Index. Readers should note that the majority of the outperformance of the S&P 500 in up markets was in 1998 and 1999 when a tech-fueled S&P 500 outperformed the Low Volatility Index. The S&P 500 would produce negative returns over the subsequent three years. Some readers might posit that they will time when to pivot to Low Volatility stocks or even to zero volatility cash from the broader equity market, capturing higher returns during bull markets while crafting their own downside protection through good foresight. For practitioners with a more cloudy crystal ball, low volatility strategies may be a good buy-and-hold strategy for producing higher long-run risk-adjusted returns. In late 2014, I published Low Volatility Strategies in Bull Markets , which showed this Low Volatility gauge had captured all of the market performance over the previous five years. To outperform low volatility stocks, investors would have had to pivot quickly to riskier equity strategies very early in the market recovery in 2009. This is easier said than done, and a buy-and-hold low volatility strategy may be of value to many Seeking Alpha readers. For investors with a higher risk tolerance and an interest in capturing incremental returns from a tilt towards higher beta stocks, read tomorrow’s article on a switching strategy using low volatility stocks and momentum that has produced tremendous long-run alpha and is one of my favorite pieces in this series. Disclaimer My articles may contain statements and projections that are forward-looking in nature, and therefore, inherently subject to numerous risks, uncertainties and assumptions. While my articles focus on generating long-term risk-adjusted returns, investment decisions necessarily involve the risk of loss of principal. Individual investor circumstances vary significantly, and information gleaned from my articles should be applied to your own unique investment situation, objectives, risk tolerance, and investment horizon. Disclosure: I am/we are long SPLV, SPY. (More…) I wrote this article myself, and it expresses my own opinions. I am not receiving compensation for it (other than from Seeking Alpha). I have no business relationship with any company whose stock is mentioned in this article.

Enhance Your Utility Sector Returns

By Alan Gula Imagine you’re a pilot who is preparing to land an airplane. You’ve just eased up on the throttle, thereby slowing your airspeed. To compensate, you gently pull back on the yoke to increase the plane’s angle of attack. A buzzer suddenly goes off… it’s the stall warning. Your approach is too slow! The aircraft is at risk of rapidly losing altitude and the consequences could be dire. The concept of a stall speed can apply to economics, as well. That is, economic output tends to transition to a slow-growth phase (stall) at the end of an expansion before the economy falls into a recession. Right now, a buzzer should be sounding at the Federal Reserve because the U.S. economy has officially slowed below stall speed. Excluding the impact of inventories, real economic growth in the first half of 2015 was just 0.54%. Lackluster wage growth also indicates continued labor market slack. In the second quarter, the Employment Cost Index, a broad measure of labor costs, posted the smallest gain since records began in 1982. Indeed, recent data further support my view that the risk of a meaningful rise in interest rates is low. And because we’re in a subdued economic growth and inflation environment, I believe that the utilities – electricity, gas, and water companies – continue to be viable investments. However, we must be wary of valuations, especially for relatively high-yielding securities. Investors starved for yield have bid up prices across the utility sector, pushing average valuations to historically high levels. We also want to avoid utilities that are excessively levered. Luckily, we can help alleviate both of these concerns with the trusty enterprise value-to-EBITDA (EV/EBITDA) ratio. Remember, the EV/EBITDA ratio compares the total stakeholder value net of cash with the total cash flows available to all stakeholders. Firms with high equity valuations and/or high debt levels have higher (less attractive) EV/EBITDA ratios. To illustrate the power of this valuation metric, I ran a backtest starting in June 1995. Here, my universe of stocks is U.S.-listed utilities with market caps above $1 billion. The stocks are ranked based on EV/EBITDA, and the top two deciles (cheapest 20%) are included in the Cheap Utilities Composite. The bottom two deciles (most expensive 20%) are included in the Expensive Utilities Composite. The screen is rerun each month and the composites change as the companies’ valuations change. The constituents are allocated to on an equal-weight basis and the cumulative total return (dividends reinvested) for each composite is tallied. The results of this backtest are shown below: As you can see, the Expensive Utilities Composite produces a cumulative return of 363% over 20 years. Meanwhile, the Cheap Utilities Composite gained an incredible 680%, which actually trounces the 451% total return posted by the mighty S&P 500 over this same time frame. Clearly, there’s an edge to buying cheap utilities based on the EV/EBITDA ratio. Furthermore, the cheap utilities also experienced smaller declines. The largest drawdown (peak to trough decline) that you would’ve experienced in the Expensive Utilities Composite was 40%, compared with just 35% for the Cheap Utilities Composite. Higher returns with lower volatility – the best of both worlds. Currently, the median EV/EBITDA for all U.S.-listed utilities with market caps greater than $1 billion is 9.9, which is relatively high. The current constituents of the Cheap Utilities Composite, which includes companies such as AES (NYSE: AES ), Ameren (NYSE: AEE ), AGL Resources (NYSE: GAS ), and Pinnacle West (NYSE: PNW ), have a median EV/EBITDA of 7.8. To make sure that the utilities you own are trading at reasonable valuations, the Key Statistics page on Yahoo! Finance has EV/EBITDA along with a host of other data. In the midst of persistently low interest rates and with an economy below stall speed, utilities are attractive investments that can help protect your portfolio from broader stock market declines. Just make sure your utilities are cheap with a low degree of leverage. Original Post

Problems With ‘The Short-Term’

Earlier this year I spoke about the problem of “the long-term” . This is the tendency for modern finance to emphasize a long-term view due to the fact that assets tend to perform well over the long term. This is empirically true. If we look at the performance of stocks, bonds and the broader economy the performance tends to skew to the upside the longer your perspective is. Unfortunately, as I’ve noted, everyone doesn’t have a “long-term”. In fact, even most young people live a life of short-terms inside of a long-term. Our financial lives aren’t this start-and-stop ride where we get on when we’re young and get off when we retire. At times the ride stops along the way and we have to get off for marriages, new homes, college expenses, emergencies, etc. That said, we also shouldn’t be in the financial markets if we have a short-term perspective. That is, given that you have to expose yourself to principal risk with any financial instrument with more than a few months of duration, you can’t be remotely long-term if you have no stomach for principal loss. This is particularly pertinent at times like these when we’re going through a substantial commodity unwind and foreign market turmoil. It’s a near certainty that any well-diversified portfolio has at least some exposure to these events. The reality is that most of us have a multi-temporal or a cyclical time frame of the financial world. It’s neither a long-term nor a short-term. It’s usually something in the middle. And when we veer too far in one direction or the other we tend to get in trouble. The problem with the short-term is multifaceted: A short-term view tends to result in account churning, higher fees, higher taxes and lower real, real returns. A short-term view often results in reacting to events AFTER the fact rather than knowing that a well-diversified portfolio is always going to experience some positions that perform poorly in the short term. Short-term views are generally consistent with attempts to “beat the market” which is a goal that most people have no business trying to achieve when they allocate their savings. If you have an excessively short time horizon you probably aren’t going to respond well to market turmoil. I’ve found that there is nothing more difficult in the investment world than understanding how the concept of time applies to someone’s portfolio. As with so many things in life the truth often resides somewhere in the middle. And if you can maintain that cyclical view without being irrationally long-term or short-term you’re very likely to achieve performance that is in line with your broader financial goals. Share this article with a colleague