Tag Archives: nreum

5 Best Rated Diversified Bond Mutual Funds

Fixed-income securities are the preferred choice of investors who are ready to forgo capital growth for regular income flows. The expense involved in creating such a portfolio of bonds from different categories may be quite considerable. This is why most investors select mutual funds since they are a convenient and affordable method of investing in bonds. Also, diversified bond funds further reduce the risk involved by holding securities from different sectors. A downturn in any one sector therefore only has a partial effect on the fund’s fortunes. Below we will share with you 5 top-rated diversified bond mutual funds. Each has earned a Zacks #1 Rank (Strong Buy) as we expect these mutual funds to outperform their peers in the future. Nuveen Preferred Securities A (MUTF: NPSAX ) seeks high level of current income. NPSAX invests a major portion of its assets in preferred securities. The advisor invests a minimum 25% of its assets in the preferred securities of companies primarily involved in financial services. NPSAX invests a minimum half of its assets in securities rated investment grade. The Nuveen Preferred Securities A is non-diversified fund and has returned 4.4% over the past one year. NPSAX has an expense ratio of 1.07% as compared to category average of 1.38%. Columbia Strategic Income A (MUTF: COSIX ) invests in three categories of debt securities. These include U.S. government bonds that may include asset-backed securities; foreign securities, including those issued from emerging markets, and corporate debt securities that may be rated below investment grade. Columbia Strategic Income A has returned almost 2% in the last one-year period. Colin Lundgren is the fund manager and has managed COSIX since 2010. Toreador Core Retail (MUTF: TORLX ) seeks long-term capital growth and uses options to hedge its portfolio from risks. TORLX invests mostly in domestic and foreign large-cap companies. The market capitalizations of these companies are identical to those listed in the S&P 500 Index or the Russell 1000 Index. The Toreador Core Retail has returned 8.2% over the past one year. As of April 2015, TORLX held 93 issues, with 6.19% of its total assets invested in Intel Corp. (NASDAQ: INTC ). Fidelity Total Bond (MUTF: FTBFX ) invests a lion’s share of its assets in debt instruments and repurchase agreements. FTBFX follows the Barclays U.S. Universal Bond Index in order to invest in the investment-grade, high yield, and emerging market securities. FTBFX may invest a maximum of one-fifth of its assets in debt securities that are rated below investment-grade. The Fidelity Total Bond fund returned 2.5% in the last one-year period. FTBFX has an expense ratio of 0.45% as compared to category average of 0.84%. Federated Strategic Income A (MUTF: STIAX ) seeks a high level of current income. STIAX invests in three major categories of fixed-income securities. These include domestic investment grade, domestic non-investment grade corporate and investment graded and non-investment grade foreign investments. Federated Strategic Income A has returned 0.9% in the last one year period. As of June 2015, STIAX held 172 issues, with 54.19% of its total assets invested in High Yield Bond Portfolio. Original Post
Why Countercyclical Indexing Makes Sense

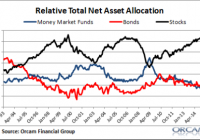
I am totally convinced that low fee indexing is the best way to allocate one’s savings (in fact, my entire company is based around this view). But when it comes to allocating that savings in a specific manner there are virtually limitless options. We know that reducing your frictions is the only way to guarantee higher returns, so it’s imperative that we be tax and fee efficient in our portfolios. But that doesn’t solve the allocation decision, which will ultimately steer our returns . It’s increasingly common for indexers to advocate a market cap weighted methodology. This is the typical “passive” indexing approach. In essence, you buy what the market generates and you never accuse the market of being wrong. So, if you wanted to be a true passive indexer today you’d buy the market cap weighting of global stocks and bonds at roughly 45/55 stocks/bonds and rebalance back to that weighting every year. You don’t deviate from this because the market is always “right” and you just want to take the market return. Easy enough.* But my economic and financial research shows something strange. This “efficient market” view of the system isn’t always right. In fact, investors and economic agents appear to make substantial errors at times. For instance, I calculated the average retail investor’s relative total net asset allocation over the last 30 years and found that retail investors, by being procyclical, are almost always positioned in the exact wrong way during the business cycle: You can see what happens here. Investors chase stocks in bull markets and they sell them into bear markets. And by doing so they end up being underweight stocks early in the market cycle and overweight stocks late in the market cycle when they’re riskiest. This is in addition to the fact that we know that most individual investors perform poorly due to very high cash balances. The most interesting part about this is that doing the opposite of this allocation (inverting the stock/bond allocation) actually generated similar nominal returns as the market cap weighting (8.2% per year vs. 8.9% per year), but improved the risk adjusted returns by a significant margin (standard deviation of 6.4 vs. 13.8). In other words, betting against the procyclical market cap weighting actually generated a better overall return. Most importantly, what this does is better align an indexer’s profile with their exposure to various asset classes over the course of the market cycle. And the beauty is, you can do this in a highly tax and fee efficient manner if you have the patience to actually let the approach play out over time. Of course, you can tweak this sort of an approach in numerous ways. That’s the essence of my approach at Orcam. But the findings are interesting – countercyclical indexing might actually be a superior approach to market cap weighted procyclical indexing. In other words, discretionary deviations from market cap weighting might not be as silly as some indexers portray. * It should be noted that even a static allocation that rebalances is always rebalancing back to imbalanced degrees of risk during the market cycle. That is, a 60/40 is actually a much riskier portfolio late in the market cycle than it is early in the market cycle. This leaves the investor who buys the 60/40 in 2009 owning a much less risky portfolio than the investor who buys a 60/40 in 2007.

All In: Mutual Fund Cash Levels Fall To A New All Time Low

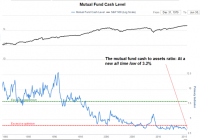
By Pater Tenebrarum Another Ominous Record is Set We have frequently mentioned the mutual fund cash-to-assets ratio in these pages, mainly because it has never been as persistently low as in recent years. At the beginning of the secular bull market in the early 1980s, it routinely inhabited the exact opposite end of the spectrum. Back then, mutual fund managers were scared of losing their clients’ money in the stock market. Today they seem only afraid of missing the next rally. Given that the indicator isn’t of short-term significance, it doesn’t need to be updated all the time, but something has just happened that gives us a good reason to report on it again. The ratio has just declined to a new all time low of just 3.2%. (click to enlarge) Mutual fund cash levels: at a new all time low of 3.2% In short, as a group, mutual fund managers have never been more thoroughly exposed to the stock market than today. Our guess is that they actually don’t “hate the market” (a story often regurgitated in the media is how “hated” the current bubble allegedly is). Along similar lines, the retail money market ratio (the ratio of retail money market funds to stock market capitalization as represented by the S&P 500 Index) sits at a mere 2.47% – just 2 basis points above the all time low made earlier this year. The reason why it has risen by 0.02% is not that retail investors have become more cautious – the reason is that the market’s capitalization has declined ever so slightly, with slightly less than half of the stocks in the S&P 500 trading below their 200-day moving averages (see also the discussion of market internals in our recent missive ” The US Stock Market and a Major Recession Warning “). (click to enlarge) The retail money market ratio: retail money market fund assets as a percentage of the market capitalization of the S&P 500. Conclusion The market has a problem that is widely ignored – sentiment is actually extremely lopsided as positioning data like those shown above indicate. The biggest source of buying power appear to be stock buybacks by listed companies these days. However, the margins of these companies have up until recently been at the very top of their historical range – they can probably only get worse from here. A few large companies (such as e.g. IBM) have already been forced to announce cutbacks to their share repurchase programs due to sharp revenue and earnings declines and their ever larger debt loads. Margin debt meanwhile remains close to an all time high. If prices begin to decline, who is going to buy? Share this article with a colleague