Tag Archives: nasdaqziv

The Beginner’s Guide To Volatility: ZIV

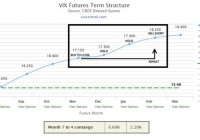
Summary We will cover the basics of ZIV. Examples of trading strategies for the mid-term futures. Current advice on ZIV. Welcome to the final part of The Beginners Guide to Volatility. I highly encourage you to view the two articles below, unless you have already read them. Some terms in this article were previously explained in the first two parts. Part One: The Beginner’s Guide To Volatility: VXX Part Two: The Beginner’s Guide To Volatility: XIV VelocityShares Daily Inverse VIX Medium-Term ETN (NASDAQ: ZIV ) This article will focus on the mid-term VIX futures. To be clear, these products are not the same as the short-term futures products we have discussed before. Some things are similar and others are very different. As a basis for discussion, we will use the inverse product ZIV. I really don’t recommend any other mid-term futures products. What are the mid-term futures? How would an inverse fund operate in the mid-term futures? See below: (click to enlarge) The mid-term futures span months four through seven. An inverse fund, which means in reverse order, sells short month seven’s contract. The fund will hold that contract (short) until selling it when it reaches month four. This process typically takes about 90 days depending on the month and expiration date of the VIX futures. As you may recall from the previous two articles, VIX futures are not the VIX Index and they trade independently of the market and level of stock prices. If you are on vixcentral.com, below the individual months you will see the month seven to four contango box. I have edited this into the above graphic. The first box represents the total percentage of contango or backwardation from month seven to four. For more on these terms, please view the first two articles in this series. The second box represents the estimated amount of contango or backwardation you could expect to profit/loss from during the next 30 days. It takes the first box and divides it by three. Again this is just an estimate. Contango/Backwardation in Mid-Term Futures Charts above and below made by Nathan Buehler using data from The Intelligent Investor Blog . Below, you will see an overlay of ZIV using the same time values to give you a clearer view of the data: Context It is important to view the above chart to put the mid-term futures into context. Although the data is back-tested, it is still relevant and useful. Had you viewed the current data alone (see below), it would appear mid-term future rarely go into backwardation. For the most part, this is true; however, you should be aware of negative economic events that would cause a deeper and more prolonged trek through backwardation. (click to enlarge) Why Consider Inverse Mid-Term Futures? Inverse mid-term futures provide a less volatile bet on decreasing volatility and/or sideways to rising markets. The best reward for your risk would be investing in these products after a dramatic and prolonged spike in the mid-term VIX futures. Historically, investing in mid-term futures now would give you a high risk and minimum reward scenario. See below for an example of a winning strategy: Winning Strategy: Let’s review two strategies that would work well. Buy ZIV once futures re-enter contango from backwardation. Risk of backwardation reappearing. Wait for backwardation and buy ZIV once 5% contango is reached. Visual (click to enlarge) Let’s go over the positives, negatives, and key takeaways with this strategy. Positives: Mid-term futures are already less volatile and less risky than short-term futures. This strategy, especially strategy two, is conservative in managing risk. Negatives: With strategy one, futures could reenter backwardation causing large losses. This opportunity will only occur once a year on average. Some periods may go longer without seeing backwardation present in the mid-term futures. It has been almost four years since the mid-term futures were in backwardation. Takeaways: Your focus on this decision should be in the strength of the U.S. economy and the ever more important global economic impact on the U.S. You need a positive economic outlook and improving or stable economic conditions for this to work as intended. Liquidity One thing you will notice about ZIV in comparison to short-term futures products is the drastically lower volumes. Average volume over the past three months is about 62,000, representing around $2.5-$3 million in transactions per day. As of writing, the fund has $123 million in assets under management (AUM). This represents about 2% of the fund being traded per day. When compared with the ProShares Ultra VIX Short-Term Futures ETF (NYSEARCA: UVXY ) that fund had about $342 million in AUM, and with its near-term average volume of 12 million shares, that represents around $360 million or over 100% of the assets in the fund being traded per day. ZIV will attract investors that are not looking for a day trade and have more of a buy-and-hold or longer-term view of the market. The low volume does not make this an illiquid investment. Conclusion The inverse mid-term VIX futures offer you another way to invest in volatility. It is a much slower pace than the short-term futures but also carries a more moderate level of risk if backwardation persists for a long period of time. Should things turn south, this product is much more forgiving in allowing you to exit a position. Short-term products often react much worse to immediate events. Now is not an opportune time to invest in the mid-term futures, but this article should have given you a good indication of what conditions would look like when the opportunity arises. I appreciate you reading this series, and I hope it continues to serves as a foundational education piece for volatility investors for years to come. My best advice is to fully educate yourself before investing in any VIX-related products. Knowledge is power and very important with this asset class. Disclosure: I/we have no positions in any stocks mentioned, and no plans to initiate any positions within the next 72 hours. (More…) I wrote this article myself, and it expresses my own opinions. I am not receiving compensation for it (other than from Seeking Alpha). I have no business relationship with any company whose stock is mentioned in this article.
Time To Buy ZIV Again

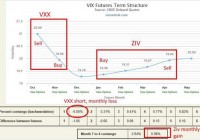
I last recommend ZIV at 39 in October. That trade worked out nicely. ZIV is back at 39 and is again an attractive buy here. I last discussed the VelocityShares Daily Inverse VIX Medium-Term Futures ETF (NASDAQ: ZIV ) in mid-October, calling it a buy to take advantage of excessive market negativity surrounding the potential for an Ebola outbreak in the United States along with uncertainty in the Middle East. ZIV proceeded to rise from 39 to 46 in a straight-line, offering near 20% gains for nimble traders. It’s time to go back to the well as ZIV is again offering a reasonable entry-point. New concerns have shaken the stock market, with pressures from plunging oil prices and earnings misses causing new waves of volatility. Again, like in October, the near-term part of the VIX futures curve finds itself in contango, meaning that it is a bit troublesome to short the iPath S&P 500 VIX ST Futures ETN (NYSEARCA: VXX ) directly. If the VIX futures curve stays where it is currently, VXX will rise gradually just from enjoying the backwardation the market is in. As you can see in the graphic shown later in this article, VXX benefits roughly 2% a month if the futures curve stays as is, which isn’t a huge headwind to the short trade, but it is a deterrent for sure. When you combine that with the cost of borrowing VXX to short, in addition to considering that short VXX has much more risk than long ZIV (since VXX tends to rally far more quickly than ZIV drops), again I’d be preferential to a long ZIV position than a short VXX position here to profit from the excessive volatility priced into the market at the moment. ZIV is an attractive long as the broader market continues to enjoy support around 1990 on the S&P 500 index (NYSEARCA: SPY ). While the market has suffered a few bumps over the past month, economic conditions remain generally favorable and the Fed doesn’t seem inclined to raise interest rates particularly quickly. Fears over Europe have plagued the market since at least 2011 and are unlikely to hold any more merit this time around. Oil prices are a potential hazard, as the energy sector has suffered severe losses, however the benefits of cheaper energy provide sufficient positive feedback to other sectors that the overall impact on the market appears to be contained. Since I last discussed ZIV, the instrument enjoyed a quick 20% rally and then has gradually slid back down to where it traded previously. With this past week’s volatility, ZIV took a nice dive, and now finds itself back at 39, where we dealt with it previously. It’s firmly back in the buy zone, and conditions are equally favorable in comparison to our last entry. I’ve reproduced the chart from our October ZIV buy at 39, with the futures curve today, ZIV also at 39. There’s one positive and one negative, and on the whole it works out to be a wash in my view. (Charts from Vixcentral.com) VIX futures October 17th, 2014: (click to enlarge) VIX futures now (as of 1pm ET Friday): (click to enlarge) On the one hand, ZIV was gaining 1% a month purely from contango. It was buying January futures at 19.36 and selling at 19.93, which produces a 3% gain on each roll. Divide by 3 (since it holds the contracts for 3 months), and you get a percent a month, or more than a 12% compounded annual return if volatility is flat and it just reaps the contango harvest. Now, however, the contango yield has fallen to roughly 0.6% a month, or a bit over 7% annualized, which is a good tailwind to the trade, but not as strong as previously. VIX futures in comparison, October 18th, 2014 versus now: (click to enlarge) However, note that the whole term structure has moved upward. Before ZIV was buying futures at 19.36 and selling at 19.93, now it is buying at 20.05 and selling at 20.45. Thus, ZIV, which is perpetually shorting VIX futures contracts, now has a notably better cost basis for its short positions. This is the beauty of ZIV as a longer-term investment or long-biased trading vehicle: ZIV’s net asset value consistently rises even as the market bounces around; returning to and then deviating again from the mean. What does this mean practically? ZIV is again at 39, where it was in October. However, ZIV’s cost basis for its short positions has now improved by 5%. Should the VIX futures head back to where they were in October, in the low-19s, ZIV would now make a 5% capital gain, moving higher to 41 per share. This before any benefits from contango. While ZIV is priced the same as during the October dip, the VIX curve is higher than before, now offering more potential upside for ZIV on a market normalization to calmer conditions. If VIX settles down in similar fashion to how it did in October, ZIV would reach 48 on this next upswing, taking it almost 25% higher and back to near 52-week highs. Taking a longer-term view of ZIV’s chart, ZIV gradually rises something along the order of 1% a month (what it earns on average from contango) while it swings upward and downward around the trend-line as the market fluctuates. ZIV’s next sustained push higher should take it above 50, as it is overdue for a new high when the market gets over its near-term crisis of confidence. The risk to the trade would be if the market has topped. At some point the bull market will end, and ZIV will no longer be an easy buy on dips. At that point we’ll have to watch the VIX structure closely to see if ZIV stays in contango or not. Should it go into backwardation, like VXX, we’d have to reconsider the viability of the trade. As it is, I don’t think the bull market has ended yet. And alternatively, short VXX will work out better than long ZIV if you are convinced that the market immediately calms down from here. In October, the panic subsided quickly, and shorting VXX did produce a better percentage gain than ZIV. This could happen again if the S&P 500 quickly moves back to its highs. As I’m not convinced this is going to happen, I’d rather take the much more conservative ZIV trade, which offers high probability of 20% near-term upside with limited downside. Disclosure: The author is long ZIV. (More…) The author wrote this article themselves, and it expresses their own opinions. The author is not receiving compensation for it (other than from Seeking Alpha). The author has no business relationship with any company whose stock is mentioned in this article.
Fire Your Investment Manager: A Refined All-Long Strategy IV

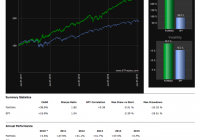
The strategy has been further improved. We use multiple markets for both return generation and hedging. This improves returns in relation to risk. The strategy can survive shocks in both the equity and the fixed income markets. Here are the refined strategy’s rules: 1. Buy SPXL (NYSEARCA: SPXL ) with 40% of the dollar value of the portfolio. 2. Buy ZIV (NASDAQ: ZIV ) with 20% of the dollar value of the portfolio. 3. Buy TMF (NYSEARCA: TMF ) with 35% of the dollar value of the portfolio. 4. Buy TVIX (NASDAQ: TVIX ) with 5% of the dollar value of the portfolio. 5. Rebalance annually to maintain the 40%/20%/35%/5% dollar value split between the positions. Here are the strategy’s results in a log scale: (click to enlarge) The strategy’s performance is outstanding. During the test period, it beats the market by over 20 percentage points per year, while enjoying a lower max drawdown. We can understand how the refined strategy accomplishes this by breaking down the strategy into its return-generating components and its hedging components . Synthetically selling Mid-Term Volatility and holding a leveraged S&P 500 position create the return-generating components of the strategy . Then, holding a leveraged Long Bond position and holding a leveraged Short-Term Volatility position create the hedging components of the strategy . The refined strategy uses multiple markets for both return generation and hedging, smoothing returns, and increasing the strategy’s robustness to shocks in both the equity and the fixed income markets. The net result is outstanding. This strategy index would be perfect for an ETF provider which wishes to launch a product which can beat the SPY even in a bull market, while also enjoying moderate correlations to both equities and fixed income. During the recent stock market confusion, the strategy has really hit its stride. The last 12 months: (click to enlarge) The last 6 months: (click to enlarge) The last 3 months: (click to enlarge) 2015 YTD: (click to enlarge) The sharpe and CAGR/Max Drawdown ratios just destroy the performance of the S&P 500. When faced with this type of technology, I cannot understand why anyone would want to invest in conventional stock picking funds or traditional asset allocation regimes such as risk parity. The strategy powers through market chop. The index is hedged multiple ways, unlike most strategies which solely rely upon bonds as the hedging component. That’s why the strategy has a low correlation to both stocks and bonds. It has volatility exposure in order to help achieve absolute returns during market dislocations. We believe that our more advanced strategies should replace most equity/bond/commodity mixes, since they are empirically safer. And after a multi-decade bond bull market, hedging using multiple markets is the responsible thing to explore.