Why I’m Not Closing My Position In Columbia Seligman Premium Tech Fund
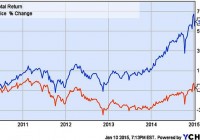
Summary I first noted STK in autumn 2013 when it had a -7.6% discount and a tax-advantaged 12.8% distribution yield. In the time since STK has had excellent performance. It’s moved from discount to premium valuation with a decrease in distribution yield. Is it time to sell? The fund is among the best of the option-income, closed-end funds and remains, in my view, a solid holding. An Update on Columbia Seligman Premium Tech Fund I first opened a position in Columbia Seligman Premium Tech Fund (NYSE: STK ) in September 2013 and wrote about it here in October 2013 . At the time the fund was moving up after mediocre performances in 2011 and 2012. It was paying a 12.8% distribution yield and sported a -7.6% discount. Four months later, after a rough patch at the year’s end, I followed up with a second look at the fund . By that time both discount and yield had given up a bit, and I suggested that the fund was ready to move up. The first chart, which shows market price and total return for the fund’s life, illustrates what happened next. As we see, at the end of 2013 STK began a sharp move up on a market price basis, earning back a good chunk of its losses from the previous years. More telling is the upswing for its total return: Remember it started the year with a distribution yield close to 13%, so distributions added nicely to the already-respectable market-price gain. (click to enlarge) Figure 1 . Market price and total return of STK for the life of the fund. Next. Let’s look at a chart showing the fund’s premium/discount status, especially looking at moves since the time of those articles. I put this at the beginning because it’s important to consider these dynamics in evaluating one’s present position in STK. (click to enlarge) Figure 2 . STK Premium/Discount History. (Source: cefconnect.com ) Note that discount has turned into a premium over the year since I last looked at STK. Premium territory is not a place STK is accustomed to finding itself as Fig. 2 shows, so I’ve begun to ask if it’s time to exit this position. I’m not alone it seems, as I have had inquiries from several readers asking my opinion on holding the fund. Before answering that question (ok, the title is a spoiler, but bear with me) let’s look the fund and how it has performed since I first brought it to your attention. The Fund STK is an unleveraged, technology, closed-end fund with an inception date of 25 November 2009. Its investment objective is to produce income and capital appreciation using a covered-call options strategy in the technology sector, a sector that lends itself especially well to that strategy. The fund maintains a managed distribution policy based on returning a 9.25% rate for IPO investors. In accord with that policy, it has paid $0.4625 quarterly since its inception. The top holdings (from cefconnect.com) are not much different from what they were a year ago: Figure 3 . STK top ten holdings. (Source: Fund Website ) One of the things that attracted me to STK in the first place was the tax status for its distributions. While generating tax-advantaged distributions is not an explicit priority for the fund, managers appear to be factoring this into their decision-making. When it first came to my attention, a large portion of its distribution was return of capital, which is tax-deferred until the fund is sold. I noted last February that I considered this run of RoC likely to end, and that prediction proved correct. May’s quarterly distribution had only $0.06 RoC and the following two quarters had none. The bulk of those distributions have been long-term capital gains, so the distributions remain attractively positioned from a tax perspective. It is sufficiently tax-advantaged (after-tax yield is better than 8.5%) as to be competitive with highly leveraged, long-duration, high-yield, tax-free, muni-bond closed-end funds on an after-tax basis for all but those in the highest marginal brackets. Performance In the next set of charts I’m going to look at performance since I first noted the fund on Seeking Alpha a few weeks after my first purchase. Let’s begin with performance of market and NAV prices. (click to enlarge) Figure 4 . Market and NAV (MUTF: XSTKX ) price performance from October 2013. The market value of STK is up about 30% in this time. Note, however, that NAV has grown only 12%. This differential illustrates one effect of the expansion of the discount to premium valuation the fund has seen over the time course indicated. How does that compare to the fund’s peers. I’ve chosen the NASDAQ index fund, PowerShares QQQ Trust (NASDAQ: QQQ ), and the Technology Select Sector SPDR (NYSEARCA: XLK ) as representative peers. Fig. 5 shows comparisons for price performance. The yellow-brown line is NAV value of STK (ticker XSTKX). (click to enlarge) Figure 5 . Market and NAV price performance for STK compared with QQQ and XLK from October 2013 through 9 Jan 2015. The market price has kept pace with both QQQ and XLK. There is a marked lagging of the peers at the end of 2013, but at today’s market the funds’ performances are essentially identical for the full time frame. Both of these charts track price performance. But, in addition to its gain in price, STK pays that hefty distribution. The yield percentage varied from 12.8% in October 2013 to 10.2% at today’s market price. If we factor those distributions into the results, a quite different picture emerges. The colors make it hard to sort QQQ and XLK; QQQ is the 34.65% line and XLK is the 31.72% line. (click to enlarge) Figure 6 . Total return from October 2013 for STK (market), QQQ, XLK. As we see, STK has been a standout for the time under consideration. One would have to look long and hard to find another technology fund that turned in as impressive a performance for these 15 months. After that stutter-step at the close of 2013 — a year-end dip that is all-too-common for closed-end funds — STK took off and continued to climb with only a brief timeout for the fall mini-correction. Note, too, that unlike last year’s situation, STK closed 2014 with a surge. Clearly, no one was taking year-end tax losses from STK in 2014, although some may have been taking profits after the new year. Outlook for 2015 An interesting aside here is that when I reiterated my confidence in STK in Feb 2014, I did so in the context of considering an uncertain market ahead for the year. I liked the prospects for technology, but I also felt that 2014 was certainly not set to repeat 2013, so I was looking for something a bit more defensive. Option-income funds are widely considered appropriate for such conditions, and I was loading up on option-income CEFs at the change of last year. In many ways, I feel similarly about 2015. I’m not one for making predictions, but I will say that I consider that it’s going to be a bit of a bumpy ride: Once again, conditions that favor option-income strategies over, say, leveraged equity CEFs. From that perspective STK looks like a solid hold. On the other hand, I’m well aware that a fair portion of STK’s 2014 outperformance is attributable to the disappearance of its discount and the expanding premium. Z-scores for 3 mo, 6 mo, and 1 yr are 1.17, 1.74 and 1.96, respectively. This puts numbers on what we see qualitatively in Fig. 1 above: STK’s P/D valuations are well above its means for this metric, nearly two standard deviations ahead for the year. Taking the 6 mo Z-score for a reference, that 1.74 value indicates a valuation that would be expected only about 4% of the time for a normally distributed population. However, a close look at Fig. 2 shows that STK’s premium discount is anything but normally distributed over the recent past. If one considers reversion to the mean to be an important driver in CEF premium/discount status, that could lead to a prediction of a decline in the premium in the coming months. The temptation then is to grab the gain created by the current 6.2% premium and move on. One problem is replacing the income. A distribution yield of 10.2% coupled with a recent history of impressive capital appreciation does not come easily. Several option-income funds gave up some ground at the end of the year (see Stanford Chemist’s thoughts on this subject), so there are possibilities, but few that will return that 10%+ and none with a year like STK’s to boost one’s confidence. The list of candidates that do yield 10%+ yields focus on global equity, a category that I’m inclined to skip at this time. For anyone less averse to increasing global exposure, the list includes Alianz GI NFJ Div Inter & Prem (NYSE: NFJ ), Eaton Vance Global Buy-Write Opps (NYSE: ETW ) (55% USA), and Eaton Vance Tax-Managed Global Fund (NYSE: EXG ). All have distribution yields greater than 10%. Another is Voya Global Advantage and Premium (NYSE: IGA ) which has 40% foreign exposure and weighs in with a yield that’s just a squeak short of 10%. But of the four only IGA was in the green for 2014 and none approached the performance of STK. I’m not looking for 2015 to be a better year for global funds than 2014. I’m much more inclined to look to tech for outperformance again this year. (click to enlarge) Figure 7 . 2014 performance of STK and some comparable global-equity option-income funds. What about the pure domestic-front funds? Eaton Vance Tax-Managed Buy-Write Opps (NYSE: ETV ) is a long-time favorite of mine. It, too, saw a run up of its perennial discount into premium territory. It is now back to a modest discount, is paying 9.3%, and may be ripe for entry. Its sibling fund, Eaton Vance Tax-Managed Dividend Equity (NYSE: ETY ), with a -8.14% discount and 9.0% distribution yield, is another prospect. However, even keeping in mind the lack of predictive value in past performances, the 2014 comparison of these funds with STK is worth pondering. (click to enlarge) Figure 8 . 2014 performance of STK and some comparable domestic-equity option-income funds. I see no good reason to anticipate a change in direction relative to STK by either at this time. Discount/Premium It does seem unlikely that STK will sustain the excellent performance of 2014 going into the near future. The premium valuation is not familiar territory for the fund and one has to wonder how stable that premium will be. But let me argue in favor of the fund retaining a modest premium, or at least not sinking back into a deep discount. This thesis is based on STK’s exceptional distribution yield, which is fixed and stable at its current level. When the fund was underperforming on NAV the yield percentage on NAV increased as the discount grew. But NAV performance has turned around and is only an impediment to investors who place high value on several-years’ old performance records (from comments I’ve received on CEFs, I realize that some do, but I’m not among them). I submit no one should be bearish on STK as long as it is keeping pace with its bogies. Furthermore, with the managed pay-out as high as it is, the NAV is less likely to climb sufficiently to lead to a much decreased yield percentage (notice how flat the NAV price line is in Fig. 4). This matters because CEF investors are primarily attracted to the space for income. There is a clear tendency by investors to price closed-end funds with regard to their market yield (sometimes to a point that investors’ logic becomes difficult to comprehend). Thus as long as NAV performance is reasonable, we should expect the market to continue to price the fund at a level that pays something not far from that 10%. Case in point: When it was paying 12-13% it attracted investors sufficiently to drive it to a premium and take the yield down to near 10%. I would argue that we’re now at equilibrium: as long as the yield percentage does not move much away from that 10%, the premium will not move much either. Thus, with the payout fixed, and no real reason to anticipate a run up of NAV that overwhelms a run up in market price and reduces the yield percentage, I would expect a fairly stable discount/premium at or near its present level. It will wander, of course, but I’m guessing we’ll not see a sharp change unless there is a problem with distribution yield. If it starts to slip, the discount/premium will go down; if it goes up, D/P will rise. Summary STK has been the star performer of the option-income category of closed-end funds. It continues to pay a tax-advantaged distribution in excess of 10%. Nothing at that distribution yield level even comes close to the overall performance of the fund over the past 15 months. Although it currently has a premium valuation, there’s a solid argument for its retaining that valuation for at least the near-term future. More importantly, I do not see an appealing alternative at this time. None of the funds that provide equivalent (and equivalently tax-advantaged) income show any indication that they are set to outperform STK significantly going forward. I think this fact helps contribute to the premium STK now holds. I am, therefore, holding my position in STK. The question for many readers will not be whether or not to hold the fund, but is it a buy?I am currently shopping this space and the only thing that might keep me away from buying more is the premium. I’m generally reluctant to buy any closed-end fund at a premium. In this case I could make an exception, for the reasons I outlined above. If, however, there is some movement away from the current premium, I would be strongly inclined to add to my position. As always, I note that I have no professional expertise on finance or taxation issues. I’m a self-schooled individual investor passing on the results of my research. I make mistakes. My situation is mine alone, and my research if focused on my portfolio and my investing priorities. Anyone who is intrigued by or finds value in my thoughts will certainly want to do his or her own due diligence to determine if my conclusions are appropriate for their unique situations.


