Tag Archives: nasdaqmsft

Why EPS And Share Price Don’t Predict Future Performance

Most analysts, and especially “chartists,” put a lot of emphasis on earnings per share (EPS) and stock price movements when determining whether to buy a stock. Unfortunately, these are not good predictors of company performance, and investors should beware. Most analysts are focused on short-term – meaning quarter-to-quarter – performance. Their idea of long term is looking back 1 year, comparing this quarter to the same quarter last year. As a result, they fixate on how EPS has done and will talk about whether improvements in EPS will cause the “multiple” (meaning stock price divided by EPS) to “expand.” They forecast stock price based upon future EPS times the industry multiple. If EPS is growing, they expect the stock to trade at the industry multiple, or possibly somewhat better. Grow EPS, hope to grow the multiple, and project a higher valuation. Analysts will also discuss the “momentum” (meaning direction and volume) of a stock. They look at charts, usually less than one year, and if price is going up, they will say the momentum is good for a higher price. They determine the “strength of momentum” by looking at trading volume. Movements up or down on high volume are considered more meaningful than those on low volume. But unfortunately, these indicators are purely short-term, and are easily manipulated so that they do not reflect the actual performance of the company. At any given time, a CEO can decide to sell assets and use that cash to buy shares. For example, McDonald’s (NYSE: MCD ) sold Chipotle and Boston Market. Then, the leadership took a big chunk of that money and repurchased company shares. That meant McDonald’s took its two fastest-growing and highest-value assets and sold them for short-term cash. They traded growth for cash. Then leadership spent that cash to buy shares, rather than invest in another growth vehicle. This is where short-term manipulation happens. Say a company is earning $1,000 and has 1,000 shares outstanding – so its EPS is $1. The industry multiple is 10, so the share price is $10. The company sells assets for $1,000 (for the purpose of this exercise, let’s assume the book value on those assets is $1,000 – so there is no gain, no earnings impact and no tax impact.) Company leadership says its shares are undervalued, so to help out shareholders it will “return the money to shareholders via a share repurchase” (Note, it is not giving money to shareholders, just buying shares.) $1,000 buys 100 shares. The number of shares outstanding now falls to 900. Earnings are still $1,000 (flat, no gain), but dividing $1,000 by 900 now creates an EPS of $1.11 – a greater than 10% gain! Using the same industry multiple, analysts now say the stock is worth $1.11 x 10 = $11.10! Even though the company is smaller has weaker growth prospects, somehow this “refocusing” of the company on its “core” business and cutting extraneous noise (and growth opportunities) has led to a price increase. Worse, the company hires a very good investment banker to manage this share repurchase. The investment banker watches stock buys and sells, and any time he sees the stock starting to soften, he jumps in and buys some shares so that momentum remains strong. As time goes by and the repurchase program is not completed, he will selectively make large purchases on light trading days, thus adding to the stock’s price momentum. The analysts look at these momentum indicators, now driven by the share repurchase program, and deem the momentum to be strong. “Investors love the stock”, the analysts say (even though the marginal investors making the momentum strong are really company management), and start recommending to investors that they should anticipate this company achieving a multiple of 11 based on earnings and stock momentum. The price now goes to $1.11 x 11 = $12.21. Yet, the underlying company is no stronger. In fact, one could make the case it is weaker. But due to the higher EPS, better multiples and higher share price, the CEO and her team are rewarded with outsized multi-million dollar bonuses. But over the last several years companies did not even have to sell assets to undertake this kind of manipulation. They could just spend cash from earnings. Earnings have been at record highs – and growing – for several years. Yet, most company leaders have not reinvested those earnings in plant, equipment or even people to drive further growth. Instead, they have built huge cash hoards , and then spent that cash on share buybacks, creating the EPS/multiple expansion – and higher valuations – described above. This has been so successful that in the last quarter, untethered corporations have spent $238B on buybacks, while earning only $228B . The short-term benefits are like corporate crack, and companies are spending all the money they have on buybacks rather than reinvesting in growth. Where does the extra money originate? Many companies have borrowed money to undertake buybacks. Corporate interest rates have been at generational (if not multi-generational) lows for several years. Interest rates were kept low by the Federal Reserve hoping to spur borrowing and reinvestment in new products, plant, etc. to drive economic growth, more jobs and higher wages. The goal was to encourage companies to take on more debt, and its associated risk, in order to generate higher future revenues. Many companies have chosen to borrow money, but rather than investing in growth projects, they have bought shares. They borrow money at 2-3%, then buy shares – which can have a much higher immediate impact on valuation – and drive up executive compensation. This has been wildly prevalent. Since the Fed started its low-interest policy, it has added $2.37 trillion in cash to the economy. Corporate buybacks have totaled $2.41 trillion. This is why a company can actually have a crummy business and look ill-positioned for the future, yet have growing EPS and stock price. For example, McDonald’s has gone through rounds of store closures since 2005, sold major assets, now has more stores closing than opening and has its largest franchisees despondent over future prospects . Yet, the stock has tripled since 2005! Leadership has greatly weakened the company and put it into a growth stall (since 2012), and yet, its value has gone up! Microsoft (NASDAQ: MSFT ) has seen its “core” PC market shrink, had terrible new product launches of Vista and Windows 8, wholly failed to succeed with a successful mobile device, has written off billions in failed acquisitions, and consistently lost money in its gaming division. Yet, in the last 10 years, it has seen EPS grow and its share price double through the power of share buybacks from its enormous cash hoard and ability to grow debt. While it is undoubtedly true that 10 years ago Microsoft was far stronger as a PC monopolist than it is today, its value today is now higher. Share buybacks can go on for several years. Especially in big companies. But they add no value to a company, and if not exceeded by re-investments in growth markets, they weaken the company. Long term, a company’s value will relate to its ability to grow revenues and real profits. If a company does not have a viable, competitive business model with real revenue growth prospects, it cannot survive. Look no further than HP (NYSE: HPQ ), which has had massive buybacks, but is today worth only what it was worth 10 years ago as it prepares to split. Or Sears Holdings (NASDAQ: SHLD ), which is now worth 15% of its value a decade ago. Short-term manipulative actions can fool any investor and keep stock prices artificially high, so make sure you understand the long-term revenue trends and prospects of any investment, regardless of analyst recommendations.
Choosing Which Stocks To Sell For A Big Purchase

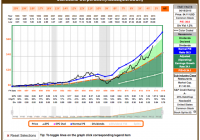
Summary This article outlines the thinking process of needing to sell some stocks for a big purchase. Know how much cash is needed to liquidate from stocks, so as not to sell more than needed. Must keep emotions in check, and sell stocks based on company valuation and future prospects of the business. Here’s a little background story to my situation. The Situation of Being Carless I recently sold my 2001 Toyota Echo. I bought it used about three years ago. The odometer indicates mileage of over 320,000km. While I owned it, other than the usual maintenance, I replaced the battery and the exhaust pipe. I managed to sell it for $500 less than my buying price. Not too shabby. I’m not one who drives a lot, but I only noticed how inconvenient it is after I sold the car. Now, I’m looking for another car. I’m still debating whether to buy a new car or a pre-owned one. Someone that knows a lot more about cars than me said that it’s probably better to buy a new one now that I got several years of driving experience down my belt. Further, it could be risky buying a pre-owned car because I don’t know its history. The previous owner could also have hid facts about crashes the car had experienced or changed the odometer. The ideal situation is that I anticipated I’ll need to “invest” in a car a couple years before and actually saved up for it. As we know, the general principle is to not put money into the stock market if you plan to use it within 5 years. The reality is I did not save up, and I don’t have a lot of cash on hand. So, other than to stop buying stocks in the meantime, I also needed to sell some of my shares. Emotionally, I don’t want to sell at a loss, and some of my holdings are in the red, especially energy companies. At the same time, I also want to take profit in my biggest winners. However, the better way is to try to suppress my emotions, and look at valuations and future earnings estimates instead. So, I should be looking at the valuations of all of my holdings and deciding which ones are possible sells. I especially don’t want to sell my core holdings, but if they’re excessively overvalued, or I feel less comfortable with them for some reason, it might make sense to take some shares off the table and take some profit. Unfortunately, I made some sales before I wrote this article. I notice I’m much more logical and less emotional when I rethink the process in writing. How did I Choose What to Sell? It is through this event that I realize more prominently that I’m less comfortable with some stocks than others. In other words, this exercise more critical helps me determine what I should be holding or not. Further, I also look at valuation, as well as compare a holding’s future prospects with others. Another consideration is gains. The market is uncertainty; it could drop 25-50% for whatever reason at any time period. Still, I would probably regret later by selling some shares in my winners, as some would be against clipping the wings of their winners. Royal Bank of Canada Royal Bank of Canada (NYSE: RY )’s shares are fairly-valued today. F.A.S.T. Graphs shows consensus analyst estimates of 4.7% earnings growth going forward. Adding that to its current yield of 3.9%, it indicates an estimated return of about 8.6% in Royal Bank shares today, which is an acceptable return for a blue chip investment. In Q2 2015, 63% of Royal Bank’s revenue came from Canada. The housing bubble has been the topic at the dinner table in recent years, especially in popular cities such as Vancouver and Toronto. The fear is that the average income cannot pay for the average housing prices. In January 2015, the Huffington Post’s article shows the income you need to buy an average house across Canada . In Toronto, an average household income of C$113,009 is needed for an average-priced house or condo of C$587,505 at the low mortgage rate of 2.99%. The monthly mortgage payment turns out to be C$2,560. If rates rose to 6%, the 2005 rate, the required household income would be raised to C$143,182. It’s worse in Vancouver. An average household income of C$147,023 is needed for an average-priced house or condo of C$819,336 at the low mortgage rate of 2.99%. The monthly mortgage payment ends up being C$3570. If rates rose to 6%, the 2005 rate, the required income would be raised to C$190,581. Of course these numbers are just that — an average. And it also makes a difference how much down payment a family has saved up. Still, it doesn’t change the fact that housing prices have been on the rise for over a decade in those cities. And with income levels misaligning with housing prices, there could be a ripple effect if the prices started to drop. I sold some shares in Royal Bank, and will continue monitoring, but I want to emphasize that if I had cash on hand to make my purchase, I wouldn’t have sold my shares. Baxter International I started a position in Baxter International (NYSE: BAX ) as a non-core. Then, I made it core. And now I sold out of it. It was a small position and I suppose I wasn’t strongly attached to it. I sold it essentially at breakeven. I might still receive a tiny position in Baxalta, as I sold it on June 16, but the settlement date is a few days later, while the company spins off the Baxalta shares to shareholders as of the record date of June 17. If I do receive shares of Baxalta, I’ll be monitoring it and decide if I want to add to the position later on. Starbucks Some of you might stare in disbelief that I sold some shares of Starbucks (NASDAQ: SBUX ). It has been one of my biggest winners with 50% gain. The high P/E is scaring me a little. I certainly wouldn’t add shares at a P/E of 36. Looking at the F.A.S.T. Graph below, it’s at the high end of its valuation. (click to enlarge) If it trades sideways again, so that earnings catch up some, I might add to my position again. Actually, I should have sold McDonald’s (NYSE: MCD ) before selling Starbucks because Starbucks has better future prospects. However, my McDonald’s shares are below my breakeven point, and psychologically, it’s hard for me to separate from those shares at present levels. That said, in hindsight, I shouldn’t have bought McDonald’s at the price that I did. And a thought just came to me…I should have sold McDonald’s at a small loss and kept my Starbucks shares because I believe Starbucks will outperform McDonald’s in the future. Whoops, I guess I should have written this article before I took action. I’m still a bit short on cash, so I might revisit my decision on McDonald’s next week. Microsoft Lastly, I sold some shares in Microsoft (NASDAQ: MSFT ). The other technology companies I hold are International Business Machines (NYSE: IBM ) and Qualcomm (NASDAQ: QCOM ). IBM is a core holding that I believe is much more undervalued than Microsoft. IBM’s P/E is under 11 and Qualcomm’s is under 14, while Microsoft’s is under 18. Consensus analyst estimates Microsoft’s earnings to grow at 6.7% in the near term, Qualcomm’s to grow at 1.3%, and IBM’s to grow at 5.1%. If I didn’t need the money, I wouldn’t sell the Microsoft shares because they’re not excessively overvalued. In Conclusion Looks like I couldn’t keep my emotions entirely at bay, but in writing this article, I believe my thought process became clearer and less sentimental. It would certainly have helped if I had a set of rules for selling stocks ahead of any sales based on allocation, diversification, quality, valuation, and future prospects. Ask Yourself Do you need to sell some of your stocks to make a purchase? Do you have a set of rules to determine what to sell when you need to? Do you ever sell for the sake of taking profit off the table to preserve gains and capital? If you like what you’ve just read, please consider clicking the “Follow” link at the top of the page, above the article title, to receive an email notification when I publish a new article. Disclosure: I am/we are long IBM, MCD, MSFT, QCOM, RY, SBUX. (More…) I wrote this article myself, and it expresses my own opinions. I am not receiving compensation for it (other than from Seeking Alpha). I have no business relationship with any company whose stock is mentioned in this article. Additional disclosure: I’m not a certified financial advisor, and this article is not advising to buy or sell any security. Please use it as initial research.

Managing Volatility, Earnings And Why Agriculture?

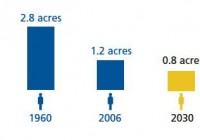
The portfolio will always have cash on had to deploy into depressed sectors. Currently we are watching agriculture & Gold mining shares. Agriculture has fantastic fundamentals. I can only see future growth in this sector. Earnings on one of our underlyings (Proctor & Gamble) has been disappointing. Nevertheless we will continue to hold as the company is going through a period of transition. So we have started a portfolio which is producing regular income ( I will post January Income results at the end of the month) but what do we do when we want to add savings to our portfolio on a monthly or yearly basis? To explain this point further, let me illustrate an example. Imagine that at a given point in time in our portfolio (asset class A & asset class B) have done the following over 5 years. Both asset classes started out at zero and we invested $10,000 per year into each asset class. Study both tables below and choose the asset class that you think would have given the best return. Asset Class A Year 1 Unchanged – $100 per share Year 2 Value Drops to $60 per share Year 3 Remains unchanged at $60 per share Year 4 Shoots up to $140 per share Year 5 $100 per share – Where it started Asset Class B Year 1 Unchanged Year 2 Value Increases to $110 per share Year 3 Increases to $120 per share Year 4 Increases to $130 per share Year 5 Finished at $140 per share It may come to surprise you that “Asset Class A” (higher volatility) would have yielded better results and more income. Asset Class B would have risen to $59,150 but “Asset Class A” would have risen to $60,048! – a profit of $10,048. Moreover “Asset Class A” finishes where it started – at $100 per share! How can we use this information for our 1% portfolio? Two things are obvious in my mind. 1. We will never have all our capital invested 2. When individual asset classes become depressed, we will aggressively invest more into that sector. We currently have $460k invested out of a possible million and the depressed sectors that are on my radar are agriculture and Gold mining stocks. We already have capital deployed in these sectors but we will deploy more if we see more weakness. Yesterday we invested in (NYSEARCA: MOO ) and (NYSEARCA: DBA ). Why agriculture and why now? The fundamentals for this asset class are excellent. Let’s go through them. 1. We are losing farmland at an astonishing rate. Moreover, when you combine this with an ever increasing population, this sector screams under-supply. The graphic below shows where we are in terms of arable land on a per person basis 2. The biofuel industry has also put pressure on the agricultural industry. I expect corn, sugar and our ETFs to rise when the price of oil rises as governments continue to invest in renewable energies such as corn and sugar cane-based ethanol. 3. 3rd fundamental is China. With a population of well over a billion and with millions of Chinese joining the middle class, grains supply are taking a hit. Wheat supplies are already falling as middle class Chinese turn to meat. In order to produce meat on mass, cattle must be fed grains. There is a direct link between a growing middle class and higher grain consumption. If China’s middle class continues to grow, grains supply will fall even more 4. Agricultural products could really spike in price if China doesn’t sort out their water problem. China feeds 20% of the world’s population so obviously water is fundamental in maintaining this part of their economy. The problem is far from solved despite the huge sums of money that has been invested by the government. Any disruption here would be ultra bullish for our agriculture ETFs. There are so many reasons to be long agriculture. We will leave our allocation as it is at the moment and then invest more aggressively when we see the trend changing. Earnings are coming in thick and fast in the US but for the most part, they have been disappointing. Big companies such as Microsoft (NASDAQ: MSFT ), Caterpillar (NYSE: CAT ) and (NYSE: UPS ) missed earnings estimates by a big margin. Moreover Procter & Gamble (NYSE: PG ) announced a reduction in earnings of 34% ! Since we have Procter & Gamble in our portfolio, I want to talk a bit about it here. First of all, profits are going to be effected in the short term because of the strong dollar. Its PE ratio is now 22, price to sales ratio is 2.92 and projected sales growth for 2015 is 2.9%. Analysts believe this company is expensive as its stock rose 14% in value in 2014 in the midst of bad earnings. However we are income investors and Procter & Gamble has raised its dividend for 58 years straight! Many investors forget that yields in bellwether stocks go up when the stock price falls. It raised its dividend relentlessly in 2008 and I have no doubt this measure will continue. The company continues to grow even though profits are down in the short term. Also the company needs time to restructure. In 2014 alone Procter & Gamble cut costs aggressively by deciding to stop marketing underperforming brands so it could concentrate on their top performing brands. This was a smart move in my opinion. Usually in business, 80% of your sales come from 20% of your products (80-20 rule). Therefore the company has decided to focus exclusively on its profitable products and ditch the lethargic ones. Firstly it exited the pet food industry last April by selling its pet food brands for almost $3 billion. Then last November, it sold its Duracell brand to Berkshire Hathaway (NYSE: BRK.A ) (NYSE: BRK.B ). Then last month the company sold its Camay and Zest brands to Unilever (NYSE: UL ). A strong dollar is going to make Procter & Gamble even more competitive which will benefit the company and shareholders in the long run. We will continue to hold in our 1% portfolio because the company has always adapted to changing times as the long term chart shows.