Tag Archives: nasdaqdxkw

Will South Korean Equities Take Off After A Japanese Rally?

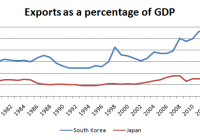
Summary Over the decades, the South Korean economy has become heavily dependent on exports. In recent years, strong won have not facilitated growth of South Korea’s GDP and the profitability of local companies. Korean equities trade at very low multiples that limit the downside risk. The introduction of any monetary stimuli could potentially kick off an equity rally. In that case, DBKO could be a winning security. Unlike Japanese stocks, the South Korean equity market has not performed well in recent years. While the most popular Japanese index, Nikkei 225, has appreciated more than 110% since the start of Abenomics in late 2012, South Korean KOSPI has gained almost nothing during the same period. Even though Japan and South Korea have much in common, they are very different in many aspects as well. For example, both countries are known for exporting high-tech products and high-quality vehicles. The South Korean economy is, however, much more reliant on exports, as demonstrated by the graph below. Data Source: The World Bank Strong won and stagnating profitability The reason behind the recent lackluster South Korean equity market returns lies in weak corporate profitability caused primarily by strengthening won. While earnings of companies listed on the First Section of the Tokyo Stock Exchange rose by 97.9% from 11/30/12 (the beginning of Abenomics) to 4/1/2015, earnings of companies included in the MSCI Korea decreased by 2.6% over the same period. It is not a big surprise that earnings of companies such as Samsung ( OTC:SSNLF ), LG Display (NYSE: LPL ), Hyundai ( OTC:HYMPY ) and Kia Motors ( OTC:KIMTF ) were significantly hindered by strong domestic currency as more than half of their revenue comes from outside of the country. Cheap valuation Based on PE multiples, South Korean equities remain incredibly cheap in global comparison. Over the above-stated period, PE of MSCI Korea has expanded from only 10.0x to 10.3x as price and earnings remained almost unchanged. To gain a better insight, PE of TOPIX has decreased from 15.0x to 14.9x thanks to strong corporate profitability due to weakening yen. Moreover, some sectors of Korea Exchange trade at extremely low multiples. This is specifically the case with autos, semiconductors, banks and IT, which last month traded with PE of 6.13x, 8.84x, 8.16x and 10.54x respectively. Some sectors like autos and banks traded even below their book value, with PBV ratios of 0.90 and 0.56 respectively. Will BOK follow in BOJ’s footsteps and introduce monetary stimulus? Without a doubt, the relative strength of South Korean won has been distinctively magnified by foreign quantitative easing programs. South Korea has suffered a great loss of its product competitiveness on overseas markets in particular against Japan. Because both countries compete in very similar markets, the BOJ’s aggressive quantitative easing program has been fatal to South Korean exports. Despite the BOK cutting interest rates to record low levels, the question remains: What will the central bank do after it runs out of its conventional monetary policy measures? We can only speculate for now, but I don’t believe that South Korea would abandon the global currency war if it realizes how important exports are for its economy. President Park stated recently at the National Assembly: We are standing at a crossroads, facing our last golden opportunity; which road we take will determine whether our economy takes off or stagnates. Now is the time for the National Assembly, the Administration, businesses and the people to come together as one and make dedicated efforts to resuscitate the economy. Graph: JPY/KRW since the start of Abenomics (click to enlarge) Source: Yahoo Finance Conclusion The launch of any quantitative easing from the side of BOK would be a bold turning point not only for South Korean won, but also for profitability of South Korean companies as more than half of their revenue comes from abroad. Therefore, subscribing to commentaries of BOK’s board members and closely monitoring the JPY/KRW currency pair can become a potentially rewarding activity. The largest and most liquid South Korea ETF is the iShares MSCI South Korea Capped ETF (NYSEARCA: EWY ), which seeks to replicate the MSCI Korea index. However, this is not a FX-hedged fund and its capital returns in case of introduction of any monetary stimulus would be diminished by currency losses for investors denominated in U.S. Hence, I would consider buying the other two funds – the Deutsche X-trackers MSCI South Korea Hedged Equity ETF (NYSEARCA: DBKO ) and the WisdomTree Korea Hedged Equity ETF (NASDAQ: DXKW ). They both have the same expense ratio of 0.58% and around the same percentage share of assets within its top ten holdings. The key difference between these two funds is in their holdings. Whereas DXKW consists of shares of only 47 firms, DBKO is diversified across 107 companies with significant exposure to Samsung Electronics, which accounts for a fifth of the fund’s assets. Top 10 Equity Holdings as of 17-Jun-2015 Name & Ticker Weight (%) Samsung Electronics Co Ltd 20.77 Sk Hynix Inc ( OTC:HXSCF ) 4.13 Hyundai Motor Co 3.25 Naver Corp ( OTC:NHNCF ) 2.82 Shinhan Financial Group Ltd (NYSE: SHG ) 2.75 Posco (NYSE: PKX ) 2.33 KB Financial Group Inc (NYSE: KB ) 2.31 Hyundai Mobis Co Ltd 2.25 LG Chem Ltd ( OTC:LGCLF ) ( OTC:LGCEY ) 2.13 Amorepacific Corp ( OTC:AMPCF ) 2.10 Data Source: Deutsche Asset & Wealth Management I believe that significant exposure to Samsung Electronics may pay off, as it is one of the most valuable brands in the world with a proven track record of sales CAGR 20.8% from 1989 to 2013 as well as above average earnings growth potential, currently trading at 9.4x PE. Therefore, I believe that DBKO is the single best security to own for eventual South Korean economy revival. Disclosure: I/we have no positions in any stocks mentioned, but may initiate a long position in DBKO over the next 72 hours. (More…) I wrote this article myself, and it expresses my own opinions. I am not receiving compensation for it (other than from Seeking Alpha). I have no business relationship with any company whose stock is mentioned in this article.
Where To Invest In 2015 In Asian Emerging Markets

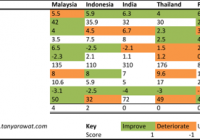
We are at crossroads of diverging monetary policies. GRI’s analyst Tanya Rawat breaks down what this means for investment in emerging markets (EM) in Asia. The U.S. gets ready to tighten policy rates whereas the Eurozone and Japan have adopted easing measures to invigorate economies at a risk of falling into a disinflationary cycle if not deflationary. Taking account of this paradigm shift, the lure of high carry, which some of the high yielding Asian currencies offer will no longer suffice, especially if U.S. Treasury yields were to rise quickly as well. The differentiating factor then in choosing the right investment destination in emerging market (EM) Asia will be domestic stability, external fundamental factors viz. current account balances, FX reserves, percentage of short-term liabilities backed by these reserves, robustness of FX policy and the credibility of the central banks. We use a rather simple scorecard methodology to choose probable winner and losers: (click to enlarge) Korea is the only the country with a positive fiscal balance and as a function of it, the lowest gross public sector debt. Add to this the layer of currency sensitivity to rising US interest rates, in 2014, the Korean Won performed the best with high core balance (current account balance + net FDI, both as a % of GDP), low real interest rates, REER undervaluation when compared to historical levels, a low leverage economy, high fiscal balance (% GDP), low gross public sector debt (% GDP) i.e. less susceptible to inflation and lastly sufficient FX cover. However, it does remain receptive to competitiveness from a weaker Yen and China’s growth uncertainty (largest export partners are China and the U.S.). Taiwan has the highest current account surplus, large FX Reserves and the highest import cover in the EM Asia universe. This makes it extremely robust to external shocks and there still remains room for inflation to catch up with the rest of the countries. While Malaysia scores well, investors should be sceptical as external FX vulnerability (exposure to changes in US rates) remains its Achilles’ heel and the country is also highly leveraged (household debt 86% of GDP). The Central bank has been sluggish in raising interest rates to curb this activity; the first hike of 25 bps since 2011 took place in the latter of 2014. Malaysia is a net oil exporter and thus remains to benefit the least from lower oil prices. Indonesia with the lowest current account balances (% GDP), import cover and highest short-term external debt (% of FX reserves), also remains quite vulnerable to US rate hikes. Also, it is one of only two countries on the planet with twin deficits; the other being India. However, the fiscal balance looks set to improve as the government stands to save highly due to elimination of fuel subsidy supported by lower oil prices, which now renders the current price cheaper than the subsidized rates. While India is neutral due to low core balance, low import cover and short-term external debt cover, it is positive that falling oil renders an improving current account balance, government savings on energy subsidies and ‘Modinomics’ that ensures momentum in economic reforms. Currently, all three rating agencies have India on a ‘Stable’ rating. Apart from offering the highest carry, inflation is trending lower as commodity prices continue to fall (CPI has a high sensitivity to energy prices) and monetary policy remains robust and supportive. Also, the Indian Central bank is keen to shift to inflation targeting from 2016 onwards (4% with deviation +/-2%). Thus far it has been enhancing credibility, largely by following prudent FX policy – absorbing portfolio inflows when they are strong and selling dollars when sentiment weakens. Reforms in the food market, rising investment in agriculture and a boost to rural productivity are necessary steps in the flight against persistently high inflation in India. Philippines and Thailand both have one of the lowest FX reserves in the world and food constitutes a high percentage of their CPI. Additionally, they do not fare well compared to other regions due to rising leverage and/or fiscal deficit, high portfolio liabilities and weaker core balances. Finally, while China offers the highest GDP growth (y-o-y) and has the largest FX reserves, it has one of the lowest current account balances (% GDP). Although signs of a fundamental slowdown in the economy became evident last year, the market was still one of the best performers in the world. This disconnect is worrying as the rapid increase in momentum came close in the heels of the opening the Chinese market to international investors via Stock-Connect. Recently, stimulus ‘steps’ are a case in point that the government is aware of this slowdown and is taking appropriate steps to alleviate the same. Investors should be skeptical of the China story simply on the basis that this time the stock market is lagging economic indicators, which maybe seen acting as a precedent to a deeper fundamental problem. Spending by the government may turn China into only the third region in the EM Asia universe with a twin deficit. (click to enlarge) (click to enlarge) 1-year (2013-14) performance of Asian EM currencies. Spot returns were trivial, while yield chasing was the norm given the rather benign carry environment. On such a playing field, the Indian Rupee was the prime victor (1M NDF Implied Yields). (Source: Bloomberg) (click to enlarge) With lower oil prices, Thailand, Indonesia, Taiwan and India standing to be relative gainers with Malaysia standing to lose as it is the only net exporter. (click to enlarge) Sensitivity of headline CPI changes to changes in energy costs. (click to enlarge) Even if the pass-through to consumer inflation is muted (as corporations will prefer to remain sluggish in lowering oil prices to maintain profitability), governments will eventually save on subsidies.

Europe’s QE Experiment: Adding Stock ETF Exposure And Hedging Against The Unforeseen

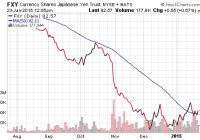
The scope and size of the European Central Bank’s latest stimulus effort has delighted the worldwide investing community. The countries/regions that are in the process of actively weakening their currencies are seeing the greatest pop in near-term equity prices. All of the safer haven currency proxies have gained ground in 2015, whereas the overwhelming majority of global growth-oriented currency ETFs are hittng 52-week lows. The scope (current euro-zone member nations) and size ($1.1 trillion euros) of the European Central Bank’s latest stimulus effort has delighted the worldwide investing community. In fact, many began betting on a monumental quantitative easing “project” the minute that Europe registered year-over-year deflation of -0.2% for the month of December. This can be seen in dollar-denominated ETF performance since the start of the 2015. The Anticipation Game: Investors Bet On Most Recent “QE” Beneficiaries Approx YTD% iShares Currency Hedged MSCI Germany ET F (NYSEARCA: HEWG ) 8.5% Deutsche X-trackers MSCI Europe Hedged Equity ETF (NYSEARCA: DBEU ) 4.3% WisdomTree Korea Hedged Equity ETF (NASDAQ: DXKW ) 0.9% WisdomTree Japan Hedged Equity ETF (NYSEARCA: DXJ ) 0.3% SPDR S&P 500 Trust ETF (NYSEARCA: SPY ) 0.0% The outperformance by Germany as well as Europe over less recent “quantitative easers” is worthy of note. It tells us that the countries/regions that are in the process of actively weakening their currencies – the ones that are actively lowering the costs of servicing their sovereign debt by the most significant amounts via ultra-low yields – are seeing the greatest pop in near-term equity prices. Indeed, the vast majority of currency ETFs are hitting 52-week lows. The ones that are not? The safer haven currency proxies which include the CurrencyShares Swiss Franc Trust ETF (NYSEARCA: FXF ), the CurrencyShares Japanese Yen Trust ETF (NYSEARCA: FXY ), the PowerShares DB USD Bull ETF (NYSEARCA: UUP ) and SPDR Gold Trust ETF (NYSEARCA: GLD ). All of these safer haven currency proxies have gained ground in 2015, whereas the overwhelming majority of global growth-oriented currency ETFs are hittng 52-week lows. Safer Haven Proxies Are Flourishing, Global Growth Proxies Are Languishing Approx YTD % FXF 13.5% GLD 9.1% UUP 4.8% FXY 1.7% CurrencyShares Australian Dollar Trust ETF (NYSEARCA: FXA ) -2.5% CurrencyShares British Pound Sterling Trust ETF (NYSEARCA: FXB ) -3.6% CurrencyShares Canadian Dollar Trust ETF (NYSEARCA: FXC ) -6.3% CurrencyShares Euro Trust ETF (NYSEARCA: FXE ) -7.0% For those who do not understand why the yen strengthens in risk-off environments, you may need a refresher on the “carry trade.” Investors borrow the low yielding yen to invest in higher yielding assets or higher appreciating assets. However, there is a serious consequence for playing the game at the wrong time; specifically, the yen rise in value when institutions and hedge funds rapidly sell stocks, higher-yielding bonds and higher-yielding currencies to avoid paying back loans in a more expensive yen. The Japanese currency can rise rapidly and the reverse carry trade can take on a life of its own. During January’s volatility in U.S. stock assets, FXY has crossed above its 50-day moving average. If the risk off volatility has truly run its course due to the European Central Bank’s mammoth QE promise and the Bank of Japan’s existing promises, FXY should stabilize rather than climb. Conversely, additional gains for FXY would suggest additional unwinding of the yen carry trade as well as a high probability of heavy volume selling of stock assets. The potential for the carry trade to unwind and the yen’s historical record as a safer haven currency is the reason for its inclusion in the FTSE Custom Multi-Asset Stock Hedge Index. This index that my Pacific Park Financial colleague and I created with FTSE-Russell- the one that many are already calling “MASH” – holds the franc, yen, dollar and gold. It also owns long maturity treasuries, zero coupon bonds, inflation-protected securities, munis, German bunds and Japanese government bonds. Year-to-date, the FTSE Custom Multi-Asset Stock Hedge Index is up 4.5%. Shouldn’t investors just play market-based securities in a way that has worked so well during the Federal Reserve’s QE3? The shock-and-awe, 1.5 trillion dollar, open-ended, bond-buying bazooka that gave U.S. stocks double-digit percentage gains in 2012, 2013 and 2014? After all, the European Central Bank (ECB) is proffering $1.1 trillion euros into 2016. The problem in the comparison between these programs is that 80% of the sovereign bonds are being bought by the national central banks and not the the ECB itself. This means that each country (e.g., Austria, Belgium, France, Germany, Greece, Italy, Spain, etc.) is responsible for its own default risk. It follows that I might be willing to add a fund like HEWG to my barbell portfolio , alongside several existing components such as the iShares S&P 100 ETF (NYSEARCA: OEF ), the Health Care Select Sect SPDR ETF (NYSEARCA: XLV ) and the Vanguard Dividend Appreciation ETF (NYSEARCA: VIG ). I might be a bit more skeptical of the i Shares Currency Hedged MSCI EAFE ETF (NYSEARCA: HEFA ), simply because of the drag of extreme debtors on the periphery of Europe (e.g., Spain, Portugal, Greece, etc.). By the same token, I have slowly increased exposure over the last three months to a number of existing holdings on the other side of the barbell. They include GLD, the i Shares 10-20 Year Treasury Bond ETF (NYSEARCA: TLH ), the Vanguard Extended Duration Treasury ETF (NYSEARCA: EDV ) and, more recently, FXY. Remember, multi-asset stock hedging does not mean that your dynamic hedging loses when riskier stock assets win. On the contrary. Both sides of the barbell tend to perform in late-stage bulls. Disclosure: Gary Gordon, MS, CFP is the president of Pacific Park Financial, Inc., a Registered Investment Adviser with the SEC. Gary Gordon, Pacific Park Financial, Inc, and/or its clients may hold positions in the ETFs, mutual funds, and/or any investment asset mentioned above. The commentary does not constitute individualized investment advice. The opinions offered herein are not personalized recommendations to buy, sell or hold securities. At times, issuers of exchange-traded products compensate Pacific Park Financial, Inc. or its subsidiaries for advertising at the ETF Expert web site. ETF Expert content is created independently of any advertising relationships.