Tag Archives: nasdaqaapl

‘Wisdom Of Experts’ Portfolio: Mid-Year 2015 Update

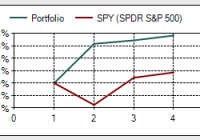
Summary Over the past 6 months the “Wisdom of Experts” Portfolio outperformed S&P500, 5.1% vs 1.1% in an equity market that largely traded sideways. AAPL and the pharma companies were the primary drivers of the outperformance of the portfolio for the past 6 month period. After a mid-year adjustment, Apple continues to be the largest component of the portfolio at 13%. Technology, finance, and large pharma comprise 90% of the updated portfolio vs 48% of these 3 sectors in the S&P500. In December 2014 we introduced a “Wisdom of Experts” portfolio based on the top picks of the 33 large cap funds scored by Morningstar as “5-star” funds. The concept we are testing is whether a top-performing portfolio can be constructed based on the top picks of the top fund managers. We won’t know the answer to this question for many years since we need to test the portfolio through bull and bear markets. But the journey has started and for the first 6 months of its existence, the portfolio has had the opportunity to perform in a market that traded sideways – and, for this short period of time, the portfolio outperformed the S&P500 based on total return, 5.1% vs 1.1%. Background – Portfolio Construction Morningstar ranks mutual funds with a star rating, with the very best funds rated with 5-stars. When we started the portfolio in Dec 2014 Morningstar rated 33 US-based large cap equity funds as 5-stars. From these 33 funds we took their top 10 holdings and scored the top holding as a “10,” the second as a “9” and so forth down to the tenth holding, which received a “1” score. We then added up all the scores and included the top 25 companies in our portfolio (the initial portfolio contained 27 companies since 3 tied for position 25). The percentage component for each holding was based on the overall score each company received. The current 5-star large cap US equity funds are presented in the table below. Over the past 6 months Morningstar downgraded 8 funds from 5-star to 4-star, so these funds are no longer included as we adjust our portfolio. On the other hand, 5 funds were upgraded to 5-star, so we now have 30 funds to re-adjust our 2Q15 portfolio. The updated portfolio, which we present at the end of the article, was generated from the top 10 holdings of these 30 funds using the same scoring system as outlined above. During the first half of 2015 the composite total return of these 30 funds was 2.7 % which slightly outperformed the S&P500 (1.1% total return). Morningstar 5-Star Large Cap US Equity Funds (date 6/30/2015) Fund Name Ticker Fund Category 2014 Performance % 2015 Performance to June 30 Alger Capital Appreciation ALARX Large Growth 11 7.3 Becker Value Equity Retail BVEFX Large Value 7 1.6 DFA Core Equity DFEOX * Large Blend 7 — Fidelity Advisor Large Cap FALIX Large Blend 6 3.0 Fidelity Puritan FPURX Mod Alloc 9 2.8 Fidelity Blue Chip Growth FBGRX Large Growth 12 6.5 Fidelity Growth Company FDGRX Large Growth 11 6.6 Fidelity Large Cap Stock FLCSX Large Blend 7 3.2 Fidelity OTC FOCPX Large Blend 14 4.8 First Trust Value Line Div FVD Large Value 12 -1.4 FPA Crescent FPACX Mod Alloc 5 0.1 Franklin Income A FKINX * Cons Alloc 1 — Guggenheim SP500Pure Growth RPG Large Growth 11 3.0 Janus Aspen Balanced JABLX Mod Alloc 6 1.0 JP Morgan US Equity JMUEX Large Blend 11 2.9 Mairs & Power Balanced MAPOX * Mod Alloc 6 — Mairs & Power Growth MPGFX * Large Growth 4 — Oakmark Large Blend OAKMX Large Blend 8 0.1 Parnassus Core Equity PRBLX Large Blend 11 -0.8 Powershares Buyback Achievers PKW Large Blend 8 2.6 Powershares Dynamic Large Cap Value PWV Large Value 8 -0.4 Powershares FTSE RAFI US 1000 ETF PRF * Large Value 8 — PrimeCap Odessey Growth POGRX Large Growth 12 4.5 Schwab US Fundamental Large Co SFLNX * Large Value 8 — Sequoia SEQUX Large Growth 5 11.2 TR Price Blue Chip Growth TRBCX * Large Growth 7 — TR Price Cap Appr PRWCX Mod Alloc 11 4.3 Vanguard Cap Opportunity VHCOX Large Growth 17 3.8 Vanguard Equity Inc VEIPX Large Value 8 0.3 Vanguard High Div Yield VYM * Large Value 10 — Vanguard Prime Cap Core VPCCX Large Growth 18 0.2 Vanguard Prime Cap Inv VPMCX Large Growth 18 1.3 Vanguard Wellington VWELX Mod Alloc 8 0.7 New 5-Star Funds in 1H2015 John Hancock Disciplined Value JVLIX Large Value — 0.6 JP Morgan Equity Income Select HLIEX Large Value — -0.3 JP Morgan Value Adv Inst JVAIX Large Value — 1.7 Laudus US Large Cap Growth LGILX Large Growth — 6.8 TR Price Value TRVLX Large Value — 1.8 Average 9 2.7 S&P 500 Index SPY 10 1.1 * Denotes funds that were downgraded from 5-star to 4-star in the past 6 months. Six-Month Performance of the “Wisdom of Experts” Portfolio The performance of the “Wisdom of Experts” portfolio since inception in Dec 2014 is presented in the Table below. Over the past 6 months the portfolio has outperformed the S&P 500, 5.1% vs 1.1%, based on total returns that include dividends. (Total returns are based on data from Morningstar). “Wisdom of Experts” Large Cap Portfolio – 1H2015 Performance (data from 12/31/2014 through 06/30/2015) Comments on 1H2015 Performance Two of the three top holdings of the portfolio had strong gains, AAPL and JPM, while MSFT fell slightly. Apple (NASDAQ: AAPL ) justified its selection as the #1 holding of the portfolio and was a key reason for the outperformance vs SPY. AAPL advanced 15% for the first half of 2015. Coupled with an 11% component of the portfolio, AAPL contributed to about one-third of the 5.1 % portfolio gain. Microsoft (NASDAQ: MSFT ) lost 3% over the first 6 months of the year, mostly treading water with the rest of the overall market. JP Morgan Chase (NYSE: JPM ), the third largest holding at 6.4%, contributed to overall gain of the portfolio with a solid 11% gain over the first half. The top performer of the portfolio over the first half of 2015 was Amazon (NASDAQ: AMZN ), advancing 41%. Healthcare comprised 26% of the portfolio but accounted for half of the 5.1% gain for the portfolio in 1H2015. Top performers included GILD, LLY, BIIB, and ACT (now AGN). Gilead (NASDAQ: GILD ) advanced 24% for 1H2015, helped by a sell off right before the end of 2014 when ABBV launched Viekira Pak and made a deal with Express Scripts to exclusively use Viekira Pak. GILD countered with several exclusive deals of its own and the launch of Harvoni in the US topped most analyst expectations in 1Q. Interestingly, however, GILD has dropped out of our portfolio (see below) in the mid-year update as the top funds have perhaps questioned the sustainability of HCV revenue and earnings moving forward. Eli Lilly (NYSE: LLY ), up 23% in 1H15, continues on a roll after a total return of 40% in 2014. LLY is included as a top 10 holding in only 5 of the 30 funds, but is one of the top 4 holdings in each of these funds, which is the reason for the overall high ranking of the company in our portfolio. Hopes are high for two drugs in development, evacetrapib, to lower cholesterol, and solanezumab, for Alzheimer’s. Leerink predicts a 50% probability of success for evacetrapib and a 20% to 30% probability of success for solanezumab. Biogen (NASDAQ: BIIB ) gained 19% in 1H2015 as excitement grew over its drug candidate that showed cognitive improvement in Alzheimer’s patients, the first drug candidate to do so in a meaningful way. As reported in a New York Times article , 166 patients with early stage disease participated in the study. While plaque was cleared and cognition was improved, the drug candidate caused brain swelling at the highest dose. Actavis, now renamed as Allergan with ticker AGN, gained 19% for 1H2015. This company has been built on acquisitions and is now a leader in both generics and proprietary drugs. In July 2014 Actavis acquired Forest Labs in the largest pharma M&A deal of 2014. In March of this year, Actavis completed the acquisition of Allergan to create a diversified global pharma company with $23 billion in annual sales. Dragging down the performance of the portfolio was LUV (-20%), perhaps expected after a run up of 121% in 2014, as well as the large oil stocks XOM (-9%) and CVX (-12%). PG also declined 10% as this large consumer staple company is shedding unprofitable brands and hoping to rekindle growth based on its most innovative products. Investors are perhaps wondering if this company continues to deserve its high P/E (20). As discussed below, both CVX and PG have dropped out of our portfolio at the 2015 mid-point portfolio re-adjustment. “Wisdom of Experts” Portfolio Adjustments, 2Q2015 As discussed in the background paragraph, the portfolio is comprised of the top holdings of 5-star large cap funds. These funds adjust their portfolios on a routine basis and report their holdings and percentage composition once per quarter. In addition, Morningstar has made several changes to their 5-star ratings. Nonetheless, the adjusted portfolio, as presented below, has not changed that drastically over the past 6 months. Mid-2015 Wisdom of Experts Portfolio Rank Ticker % of Portfolio Jun2015 % of portfolio Dec 2014 Dividend Yield %* Forward P/E* Beta 1 AAPL 13.0 11.2 1.5 13 1.07 2 JPM 6.4 6.4 2.3 11 1.37 3 WFC 6.3 4.4 2.5 13 0.83 4 GOOGL 6.0 5.0 0 17 0.86 5 MSFT 5.5 10.3 2.7 16 0.73 6 BIIB 5.1 3.5 0 25 0.58 7 FB 4.6 3.1 0 34 0.77 8 AMGN 4.5 4.6 1.8 15 0.63 9 AMZN 4.4 2.4 0 91 1.48 10 LLY 4.1 2.8 2.3 24 0.40 11 PFE 3.7 2.9 3.2 15 0.86 12 MRK 3.5 0 3.1 15 0.40 13 GE 3.1 2.8 3.4 17 1.56 14 JNJ 2.9 4.3 2.9 16 1.03 15 C 2.9 1.7 0.1 10 1.41 16 BAC 2.8 4.1 1.1 11 0.84 17 AGN 2.5 2.1 0 14 0.74 18 V 2.4 0 0.7 23 0.83 19 XOM 2.4 5.2 3.3 16 1.11 20 DHR 2.2 0 0.6 17 1.09 21 MA 2.1 0 0.6 23 1.36 22 RHHBY 2.1 2.7 2.8 26 0.78 23 LUV 2.1 2.2 0.7 10 0.86 24 TXN 1.8 0 2.5 17 1.16 25 IBM 1.8 0 2.8 10 0.86 Composite 1.6 19 0.93 SPY 1.9 18 1.00 *Dividend yield and forward P/E source: Morningstar. Companies in bold are new additions at mid-year readjustment. Apple remains the top holding of the portfolio, with its composition increasing from 11% to 13%. AAPL is the #1 holding in 8 of the 30 5-star funds and is a top 10 holding in 15 of the 30 funds. AAPL continues to be attractive to both value and growth fund managers. While MSFT is a significant component of the portfolio at 5.5%, its popularity among these top-rated fund managers has declined from 10% at the end of 2014. Eight companies dropped out of the portfolio: CVX, T, GILD, ORCL, PG, HD, TGT, and VZ. New additions included large pharma blue-chip Merck, industrial conglomerate Danaher, the credit card companies Visa and Mastercard, and the technology companies Texas Instruments and IBM. As shown below these changes increased the concentration of the portfolio, with 90 % of portfolio now comprised of technology, healthcare, and financial services vs 48% for SPY. Sector weighting of “Wisdom of Experts” Portfolio vs S&P500 Sector Wisdom Of Experts Portfolio Dec2014 Wisdom Of Experts Portfolio Jun2015 SPY Dec2014 SPY Jun2015 Technology 34 37 18 18 Financial services 17 24 15 15 Healthcare 26 29 15 16 Industrials 3 5 11 11 Consumer Cyclical 2 2 10 11 Consumer Defensive 5 0 10 9 Energy 8 2 8 8 Communication 5 0 4 4 Utilities 0 0 3 3 Basic Materials 0 0 3 3 Real Estate 0 0 2 2 Other Statistics of Portfolio Dividends Dividend yield of the portfolio has declined from 2.0% at inception in Dec2014 to 1.6% at mid-year and is now below the 1.9% yield of S&P500. Five companies in the portfolio have no dividend: GOOG, FB, BIIB, AMZN, and AGN. Beta Beta, a measure of volatility and risk, is slightly lower than S&P500 at 0.93 vs 1.00 for the benchmark. For this short period of time, then, the investor is benefiting from increased gains with no increase in risk. P/E The forward P/E for the portfolio is 19, very close to the S&P500 (18). Timeliness of Portfolio Adjustments One major drawback to this approach to portfolio construction and adjustment is that we do not receive real time updates of a fund’s holdings. Our portfolio cannot be nimble in making changes, as opposed to the funds which can buy or sell on real time news. Most of the funds update their holdings quarterly so we are always going to be a step behind the actions of the fund managers. As an example, our December portfolio had reasonable holdings of ExxonMobile and Chevron. Now XOM has dropped from 5.2% of the portfolio to 2.4% and CVX has completely dropped out. Fund managers may have made these changes early in 2015, but we are just now making the change to our portfolio. Nonetheless, 19 of the 27 companies that were included in the Dec 2014 portfolio are still represented today, so the portfolio does not have as much turnover or churn as might be expected. Summary The “Wisdom of Experts” is an eclectic collection of large cap companies which represent the best ideas of the best fund managers. For the first 6 months of its existence, an admittedly very short time frame, the portfolio has outperformed SPY, 5.1% vs. 1.1%. To compare to other averages, the Dow Jones Industrials, as represented by the ETF DIA, was flat for the first half of 2015. The Nasdaq 100 (NASDAQ: QQQ ) was up 4.0% over this time frame and was also aided by a large 14% holding in AAPL. Finally, only 5 of the 30 5-star funds had a better 1H performance than the “Wisdom of Experts” portfolio. But again, the journey is just beginning for testing if crowdsourcing the best ideas from the best fund managers is a viable investing approach. Going forward we plan to update the portfolio on a quarterly basis to capture changes made by fund managers in a more timely manner. Disclosure: I am/we are long GILD, AAPL, GE, JNJ, WFC, MRK, VZ, CVX. (More…) I wrote this article myself, and it expresses my own opinions. I am not receiving compensation for it (other than from Seeking Alpha). I have no business relationship with any company whose stock is mentioned in this article.

The Indexer Who Was Saved By His Stock Picks

I am an indexer who completely understands that most professionals and most retail investors do not match the simple long term market index gains available. Benchmarking is important even for those with lower risk balanced portfolios. I have been correcting my Canadian home bias by dollar cost averaging portfolio income into U.S. holdings, that is starting to pay off. In 2014, ironically it was my 5 individual stock picks that carried the day for this indexer. 2014 was a very solid year for the stock markets and a very solid year for those with balanced portfolios. In fact, many investors with balanced portfolios were able to obtain near market gains, or market beating gains with much lower volatility. Based on risk adjusted returns, 2014 was certainly the year of the balanced portfolio. In 2014 and according to low-risk-investing.com the U.S. markets (NYSEARCA: SPY ) delivered 13.5%, a broad based bond index (NYSEARCA: AGG ) delivered 6%, long term Treasuries (NYSEARCA: TLT ) delivered 27.3%, International Markets (NYSEARCA: EFA ) delivered -6.2% and the Canadian Markets (NYSEARCA: EWC ) delivered 1.1%. Most of the poor results in the Canadian and International holdings for US investors were courtesy of the very strong US dollar. The Canadian markets (TSX capped composite) actually delivered 7.4% to a Canadian in 2014 according to Standard and Poor’s. On the dividend growth front the dividend aristocrats (NYSEARCA: NOBL ) delivered 15.6% while the Dividend Achievers (NYSEARCA: VIG ) delivered 9.5% in 2014. Higher yielders (NYSEARCA: VYM ) delivered 13.5%. A simple balanced portfolio with 66.6% SPY and 33.3% comprised of AGG and TLT would have delivered a very healthy 14.5% in 2014. A 50/50 stock to bond portfolio of same parts would have delivered 15.1% in 2014, and that’s with a portfolio of a volatility level of 4.8% compared to 8.2% based on the beta metrics applied on low-risk-investing.com. TLT delivered on so many fronts in 2014. I often suggest that readers consider TLT as portfolio insurance as long term treasuries often offer an inverse relationship to the equity markets in modest to severe market corrections. Here’s my article , “The Best Market Correction Insurance”. Certainly not many would have predicted that TLT would beat the pants off of the equity markets in 2014 but that was the case. I suggest TLT for periods such as this example when the markets were throwing a little tantrum. Here’s TLT vs. SPY from January 1 of 2014 to March 30 2014. The x axis represents months in duration, the y axis represents returns. TLT is in racing green. The markets are skittish, and TLT delivered in 2014 even in the most minor of corrections. TLT finished the year very strong as oil price concerns added some uncertainty. In 2014 I put my Cranky Maneuver into play with respect to our discount brokerage accounts at TD Waterhouse. For context, this investment story begins in the early to mid part of the 2000s when my approach involved a combination of ETFs and a few individual company holdings. I did very well approaching and moving through the market correction, yes I beat the broad market indices by a very large degree by buying when markets corrected and by taking on even more risk by investing in small cap and higher risk sectors such as materials and developing markets. I was also lucky enough to invest in one of Canada’s best managed funds ever – Sprott Canadian Equity. I was also lucky enough to make a mistake and have a terrible Canadian home bias. Canadian markets did very well in the last decade for U.S. 2000-2009. I was also lucky enough to have Barrick Gold (NYSE: ABX ) as a client at the time, and as I was hanging around with and befriending gold bugs they encouraged me to buy a healthy allotment of gold investments. I sold out of those toward the top of the gold price trend. Here’s Barrick from early 2002 to year end 2011. (click to enlarge) When all was said and done, I found myself with meaningful monies (well at least to me) moving out of the recession. I quickly, and early in the recovery, began moving to a more balanced approached to protect those gains. I will admit that my very conservative approach has left some money on the table if I consider the market gains that have been available from 2011. But my goal was to protect assets and create a very low volatility portfolio. Even entering 2014 our discount brokerage accounts were in the area of only 30-40% equities, and they entered the year with a still pronounced Canadian home bias (not enough US or International exposure). The portfolios displayed a very crazy low beta of .2 through any market turbulence in the years approaching 2014. In retrospect I was too conservative, especially considering that I had displayed a very high risk tolerance level through the market corrections of 2000 and the Great Recession. That said, my goal for 2014 was to ‘fix’ my home bias on the fly by investing all portfolio income into the US holdings. That strategy was designed to perform 2 functions, it would increase my equity exposure and growth potential, and it would also gradually increase my US exposure. It is also an interesting risk management tool or strategy. In rising equity markets the portfolio is obviously increasing in value while the volatility level also increases with that added equity exposure. Two measures are increasing the equity component, new monies put into the equities and those rising equity prices. The risk is managed by way of that higher portfolio value. I can look at my portfolio and say that based on historical performance of certain stock to bond allocations, my portfolio value might only drop by 15% in a 50% stock market correction. If a portfolio value went from $220,000 to $250,000 in the year and that $250,000 portfolio might potentially only fall to $212,500 in a severe correction – that draw down might be easy to stomach. The increased risk is managed by a rising portfolio value. In 2014 I was able to move the brokerage accounts to the area of 50% equities – I am happy to play this market scenario down the middle. The portfolios are set up to protect capital and they are also set up to take advantage of any real market correction that might occur. Based on the teachings of Benjamin Graham I am more than willing to move my portfolio back to 75% equities or more if ‘normal’ valuations ever return. I would or will even borrow $250,000 to invest in equities if a real opportunity presents itself. OK, to the returns for this Scaredy Cat investor. Our discount brokerage accounts offered returns in the area of 8.4% to 21% based on the return calculation function on TD Waterhouse accounts. With the best news first here’s the chart for that best performing account. Here are the returns for calendar year 2014 at 20.6%. What’s of interest in that chart is the currency adjusted benchmark of the S&P 500, it shows returns above 20% for Canadian investors. (click to enlarge) We can see that the healthy returns in this account are related to an event in August of 2014, and that event was the purchase of Tim Hortons (THI) by Burger King (BKW). I sold out all of my Tim Hortons at silly profits. As you may know Tim Hortons is the only individual pick that I hold “on purpose”. I knew the company well having been a creative director of the business back in the day when they were originally spun off from Wendy’s (NASDAQ: WEN ) in 2007; then I was a buyer. As I wrote in this article selling all of my Tim’s was a no brainer, I then put some of the profits into Berkshire Hathaway (NYSE: BRK.B ). From September of 2014 BRK.B also had a healthy beat of the market delivering a 9.4% return compared to 3.5% for SPY according to low-risk-investing.com. This Canuck of course also had an additional currency boost included in those BRK.B dollars thanks to the U.S. dollar. Do I wish I had put all of my Tims’ profits into BRK.B? Yes. And here are the returns for one of our other discount brokerage accounts. (click to enlarge) Solid returns for a very low beta portfolio, but I certainly paid for my Canadian home bias. I would have been in better shape to cut the Canadian cord and move to a more sensible US and international equity exposure at the end of 2013. But I have no regrets having recognized my ‘mistake’. I openly admit to fixing my mistakes on the fly. Sometimes your mistakes pay off (the lost decade for me) and sometimes they don’t. But the key might be that benchmarking allows you to recognize your shortcomings and fix your portfolio. So why do I think I underperformed the benchmark in that account when my incredibly low beta portfolio beat the Canadian Stock Market Benchmark? Because of this chart showing the returns for the Tangerine Portfolios. The returns are for the calendar year 2014. (click to enlarge) I would consider the Tangerine Portfolios a benchmark. They are comprised of the market indices of Canada, U.S., International along with a broad base Canadian bond index. The portfolios are rebalanced. Most of our new monies are invested into the Tangerine Balanced Portfolio in a Tax Free and RSP (Retirement Savings Plan). The Balanced Income Portfolio holds 70% bonds, the Balanced Portfolio holds 40% bonds. I have similar returns (to the 8.39% annual) in our third major discount brokerage account, but those returns were aided by the three individual stock holdings of Enbridge (NYSE: ENB ), TransCanada (NYSE: TRP ) and Apple ( AAPL ) all of which outperformed the Canadian and U.S. market indices. Apple was added in June – let’s call that a company I hold on purpose as a growth candidate. Enbridge and TransCanada are simply companies that I could not bring myself to sell when I made the switch to indexing. Apple was purchased with the same reasoning that was behind the Tim Hortons purchase – it is a company with incredible sales and profit growth and is one of the strongest brands on the planet. As a still recovering Ad Guy I don’t mind using brand strength as a guideline for a stock pick or two (I allow myself to have a little fun when investing) and I hope that Apple turns out to be as profitable as the Tim Hortons venture. So far, so good. Here’s Enbridge and TransCanada combined total return vs. SPY over the last 10 years, courtesy of low-risk-investing.com. The time horizon is January 1, 2005 to December 31, 2014. Those two dividend challengers can stay around as long as they like – but I don’t pay them much attention. All combined, our 3 major discount brokerage accounts delivered just over 11% in 2014. Of course on a risk-adjusted return evaluation that’s more than good. I beat the Canadian index with portfolios that started year with beta(s) in the area of .2. But I did give up some gains with that tardy rebalancing. I would estimate that it cost me several thousand dollars. It’s best to use benchmarking to identify weakness and put those mistakes into dollars and cents and then extrapolate those lost returns into the future. We should know the cost of our mistakes and underperformance. Moving forward I plan to continue to invest new monies into the Tangerine Balanced Portfolio, and all portfolio income in the discount brokerage accounts will be invested into U.S. equities. It’s possible that if there is a major drop in the Canadian markets some portfolio income (in the name of rebalancing) will be redirected to Canadian ETFs. Energy is certainly taking its toll on Canadian energy companies and potentially the Canadian economy. My “Learnings” Moving to eliminate my Canadian home bias was a common sense decision. A tardy rebalancing approach led to two self-directed portfolios underperforming their assigned benchmark. The non-thinking Tangerine Balanced Portfolio continues to teach me lessons that I do not always respond to. I am comfortable making a stock selection or three. A future article will explore that strategy of holding a market index as a core and then confining a few stock selections to what an investor actually knows quite well. If one is going to be a “stock picker” perhaps there is value in buying fewer companies; but companies that an investor can hold with extreme confidence. Thanks for reading, happy benchmarking, be careful out there and always know your risk tolerance level. And I’ll add “Got International?”.

Motiwala Capital Q4 2014 Letter

Summary 2014 Q4 Letter to investors. Winners and mistakes. Portfolio activity (buys, sells). Fourth Quarter 2014 Letter The year 2014 ended on a strong note with the US equity market as reflected by S&P 500 up ~14% The US markets are in an amazing six year bull market with the S&P 500 having tripled from the lows of March 2009. Motiwala Capital had a below average year with consolidated net return (after all fees and expenses) of ~4%. The consolidated number means some accounts performed below this number and some above it. See important notes at the end of the letter for more information. The performance information is shown in the table below: Year S&P 500 Motiwala Capital 2011* -1.7% 4.9% 2012 16.0% 20.3% 2013 31.9% 33.2% 2014 13.7% 3.9% 2014 Performance Overall our performance in 2014 was poor both on absolute and relative basis. There were more winners than losers but two large positions suffered large declines hurting overall performance. Positions detracting from performance included North Atlantic Drilling (NYSE: NADL ) (-80%), Prosafe ( OTCPK:PRSEY ) (-57%), CTC Media (NASDAQ: CTCM ) (-33%), Blucora (NASDAQ: BCOR ) (-27%) and International Housewares (-22%). Our biggest winners were Microcap H (+90%), Microcap L (+48%), Apple (NASDAQ: AAPL ) (+42%), Visteon (NYSE: VC ) (+40%), Microsoft (NASDAQ: MSFT ) (+25%) and Oracle (NYSE: ORCL ) (+20%). In addition, 14 of the 17 special situation investments during 2014 were profitable (or breakeven) and positively impacted our portfolio returns. We will continue to invest in this area and believe it distinguishes our management style. Discussion on winners Microcaps H and L were purchased at low valuations. Both exhibited strong earnings growth and were rewarded with higher valuations resulting in superb gains. Apple had a fantastic year, releasing exciting new products and continuing to return capital to shareholders via share buybacks and dividends. Investors were more optimistic and the share price headed higher. Visteon continued to divest non-core businesses and investors were happy. Recently, the company announced the sale of its majority stake in publicly traded Halla-Visteon for $3.6 billion. Visteon will be left with only one business segment and could be potentially acquired. Microsoft and Oracle reported business as usual generating solid free cash flow and continued buybacks and dividends. Discussion on mistakes High leverage, capex and high dividend payout The positions in North Atlantic Drilling and Prosafe hurt the portfolio returns by 6%. These were the biggest mistakes since 2011. Both companies are in the energy service industry, cyclical in nature and dependent on capital spending by large oil producers, which in turn depends on crude oil pricing. NADL and PRSEY had significant capital expenditures and high levels of debt. To add fuel to the fire, they had a high (75-100%) dividend payout policy. The combination of these three factors in a cyclical business is too risky. I will guard against this in the future. Prosafe warned about weakening demand and potential dividend cuts in its Q2 earnings. The stock price fell and I felt that the bad news was priced in. In the case of NADL, its agreement with Rosneft ( OTC:RNFTF ) did not close due to sanctions against Russian entities. NADL suspended its dividend given the weak outlook. From mid September, crude oil prices started declining and there was a meltdown in late November. Most energy related stocks including NADL and PRSEY declined sharply as result. When the situation changes I purchased shares of Russian media company CTCM Media in March 2014. My argument then was “CTCM has a solid balance sheet and produces attractive free cash flows. CTCM was purchased for 10%+ FCF yield. When Russia moves out of the front-page news, I hope the stock would be higher.” After purchase, the stock appreciated by 25% despite Russia continuing to be in the headlines. The stock was still cheap and I continued to hold. However, in late September Russia passed a law restricting ownership of Russian media companies to 20% from the prior 50%. This was unexpected and the stock price took a 20% hit. Later the stock was also hurt by the rapid depreciation of the Rubble, which was caused by the rapid decline in crude oil prices. CTCM indirectly became linked to energy prices. My mistake here was not selling immediately after the media law change, which would have reduced our losses. Portfolio Composition Our portfolios are divided into two sections. The ‘Generals’ are generally undervalued equity investments that fit the value framework. The rest of the portfolio is invested in special situations (short term investments with a specific event that unlocks value) or cash. Average cash balance at the end of 2013 was 45%. The top 5 positions add up to 25% of the portfolio. We have 16 regular positions (Generals) in our portfolio. This makes up ~45% of the portfolio. The rest of the portfolio is currently in special situations (10%) and cash (45%). Cash is 30% higher over last quarter end due to heavy selling as explained later. Portfolio Characteristics Weighted average P/E = 12 (P/E is based on 12-month trailing earnings) Portfolio dividend yield = 2.4% Weighted average Market Cap = $55 billion Price to Value (P/V) For every stock we purchase, we estimate a range of fair values. We compute a ratio of current market price (price) to estimated value (value). Price to value on the invested portfolio was 0.83. Lower P/V means better upside and limited downside. A higher P/V points to lower future upside potential for the portfolio. We will continue to look for attractive investments that will help to lower the P/V at the portfolio level. Top 7 Positions (some clients will not have all the positions and in the same weights) Company name (Ticker) % of portfolio B/S Div FCF ROIC Val Visteon (Equity and Warrants) 7.5% Y Y Microcap H 5.6% Y Y Y Y Y Outerwall (NASDAQ: OUTR ) 5.4% Y Y Y Oracle 3.6% Y Y Y Y Y Blucora 3.3% Y Y Y Y Qualcomm (NASDAQ: QCOM ) 3.1% Y Y Y Y Y Conrad Industries ( OTCPK:CNRD ) 3.1% Y Y Y Y Y For the above stocks, we have provided information about which characteristics they satisfy B/S = strong balance sheet Div = pays a dividend FCF = solid free cash flow ROIC = solid Return on Invested Capital (NASDAQ: ROIC ) Val = low/reasonable valuation Portfolio by Market Cap Micro cap 18% less than $250m Small Cap 15% $250m to $2billion Mid Cap 9% $2 billion to $10 billion Large Cap 8% $10 billion to $200 billion Mega Cap 5% $200 billion + We have invested across the market cap spectrum and are market cap agnostic. Portfolio by Sector Sector Weight Technology 12% Consumer Discretionary 12% Financials 7% Energy 6% Telecom 3% Consumer Staples 3% Industrials 1% Special Situations 11% Cash 45% We do not seek investments by sector. We make our investments one stock at a time. However, as part of risk management, we want to make sure that our investments are across multiple sectors. Portfolio Activity Special Situations: Share tenders We participated in two special situations in the quarter that were profitable. Generals: Portfolio exits: We sold out of seven positions in the quarter. Some positions were sold as they hit our price targets, while some were sold when I was concerned about the business or the situation had changed. Microsoft ( MSFT ): We purchased shares of Microsoft in early 2011 around $26. During our 3+ years holding period, Microsoft has continued to be very profitable, generate lot of free cash flow, paid dividends and buyback shares. A new CEO has come in and the market perception has improved. We sold our shares around $46 as the stock price appreciated to our price target. Vodafone (NASDAQ: VOD ): Vodafone shares were also purchased in early 2011. It owned 45% of Verizon wireless back then. After the sale of its stake in Verizon wireless, VOD made some acquisitions in Europe and decided to invest heavily in its network. The major part of its business is in Europe and has been struggling for several years. The negatives from Europe are greater than the positives from the rest of its business in Asia and Africa. Finally, VOD has gone from net cash to net debt on its balance sheet to finance the dividend and capex. These combined factors swayed us to sell the position. Amcon Distributing (NYSEMKT: DIT ): DIT was purchased in the second quarter of 2013. DIT is a wholesale distributor of consumer products to convenience stores. Since our purchase, business results have been soft with declining earnings and ROE on increasing competition. Despite this, the stock price appreciated, seemed fairly valued and we sold. Hess Corp (NYSE: HES ): We sold our remaining shares of HES. HES was purchased as a special situation when it was selling assets, paying down debt and buying back shares. HES has now become a pure play E&P company. I had no interest to own HES beyond the asset sales. I was holding on for the announced spinoff of an MLP. However, with declining crude oil prices, it made sense to close the position. National Oilwell Varco (NYSE: NOV ): NOV was another energy services company in the portfolio. It is a high quality albeit cyclical business with a solid balance sheet and generates good free cash flow. NOV was sold in response to the sharp decline in crude oil prices. A major part of NOV business is providing equipment and parts for rig systems. I do not know how this business will perform 2016 onwards given the excess supply of deep-water rigs. CTC Media : We sold our shares as explained earlier. Generals: New Positions: GameStop (NYSE: GME ) makes a second appearance to our portfolio. GME is the largest video game retailer in the world and sells new and used video game software, hardware, accessories for video game systems from Sony (NYSE: SNE ), Nintendo ( OTCPK:NTDOY ) and Microsoft. Recently, GME has diversified into other concepts such as Cricket wireless stores and Simply Mac stores. GME has generated annual free cash flow of $450 million. The capital allocation policy is impressive and allows for the distribution of up to 100% of free cash flow to share holders. We purchased shares at a dividend yield of 4% and 10x P/E. Last time we purchased shares of GME, the video game console cycle was long in its tooth. The new consoles from Sony and Microsoft were released in 2013. Sales of games for the older consoles have declined faster than the increase in sales for new consoles. This is weighing on recent results. Once software sales for newer consoles pick up, I feel the shares should get re-rated higher. Generals: Reduced positions: We reduced our large position in Conrad Industries as we grew concerned about the demand for new barges that CNRD builds. The stock appears cheap on a trailing basis but this is a cyclical business and we wanted to be a bit cautious after a superb multiyear run. We sold half of our remaining position in Apple) after the stock doubled since our investment in Q2 2013. We sold half of our position in Franklin Resources (NYSE: BEN ) as it traded close to our conservative price target. My initial assessment on the valuation was higher due to the large net cash of $8 billion (25% of market cap). However, this cash is held overseas and is unlikely to be returned to shareholders. Also, recent asset flows have stagnated at this asset management firm. Generals: Increased positions During the quarter we increased our positions in Visteon warrants (VSTOW) and International Housewares (1373) as they were attractively priced. High Cash levels Cash in the portfolio grew to an all time high of 45%. The reason for this is simply because we sold (33%) a lot more than what we bought (5%) in this quarter. It has become increasingly difficult to find attractive investments as markets overall have run up. However, I continue to look for investments to deploy some of the cash. Often investors question when there are high cash levels as it can detract from performance in a period of rising markets. The value of cash is twofold: it acts as a buffer in declining markets and the optionality it provides to make purchases. Special dividends : Once again Conrad gave us a Christmas gift and declared a special dividend of $1/share. On our original purchase price of $15, we have already received $5/share in dividends. Conrad also instituted a regular quarter dividend of $0.25/share. Asset manager Franklin resources declared a $0.5/share special dividend and raised its dividend. Other news : I am happy to report that I have moved into my new office. At year-end, our AUM was $5.4 million. We wish everyone a prosperous and happy new year 2015. Please contact me if you are interested in our managed account services. This commentary candidly discusses a number of individual companies. These opinions are current as of the date of this commentary but are subject to change. All information provided is for information purposes only and should not be considered as investment advice or a recommendation to purchase or sell any specific security. While the information presented herein is believed to be reliable, no representations or warranty is made concerning the accuracy of any data presented. This communication may not be reproduced without prior written permission from us. Past performance is no guarantee of future results. Motiwala Capital performance is computed on a before-tax time weighted return (TWR) basis and is net of all paid management fees and brokerage costs. Performance figures are unaudited. Performance of individual accounts may vary depending on the timing of their investment, the effects of additions, and the impact of withdrawals from their account. Editor’s Note: This article covers one or more stocks trading at less than $1 per share and/or with less than a $100 million market cap. Please be aware of the risks associated with these stocks.