Tag Archives: mutual funds

Best Performing Technology Mutual Funds Of Q2 2015

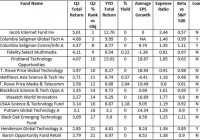
The technology sector’s earnings results have not been very encouraging this time. For the week ending Jul 17th, a good deal of tech results drove markets as earnings results and management commentary were mostly positive. However, the following week many earnings reports dampened investor sentiment. Apple did beat expectations although the surprise wasn’t as dramatic as it has been in the past. Nonetheless, excluding Apple, the tech sector’s earnings performance was weaker. In regard to mutual funds, Morningstar data showed that Technology sector mutual funds gained 1.64%. Though this return looks dismal, its compares favorably with the fact that it was one of the 6 among 15 Sector Equity Funds to have finished in the green. While it was the 5th best gainer among the Sector Equity Funds category, the technology sector ranked 14th among all categories of funds. Markets had a dismal run in the second quarter; wherein the S&P 500 and Dow declined 0.2% and 0.9%, however the Nasdaq did gain 1.8%. In the first half of 2015, fund inflow slumped 36% year on year to $143 billion. This significant decline was largely due to the dismal trend in the second quarter; wherein inflows were down to $41 billion through Jun 17, comparing unfavorably with the $102 billion of inflows in the first quarter. Tech Q2 versus Q1 Performance Coming back to the tech sector, 126 funds out of the 201 funds under the study finished in positive territory. The average gain for these 126 funds was 2.4%. While one fund had break even return, the remaining 74 funds posted an average loss of 1.2%. As for individual technology mutual funds, the best gain was 9%, which came from the ProFunds UltraSector Mobile Telecommunication Fund (MUTF: WCPIX ) . WCPIX requires a minimum initial investment of $15000. The J acob Internet Fund (MUTF: JAMFX ) was the next best gainer. JAMFX gained almost 6% and it has a minimum initial investment of $2500. Looking back at the first quarter performance, the tech sector’s gain was 3% compared to 1.64% this time. WCPIX was also the best gainer in the first quarter by gaining 13.2%. However, WCPIX has not been able to continue the momentum and has lost over 3.3% in July. The Firsthand Technology Opportunities Fund (MUTF: TEFQX ) was the next best gainer in the first quarter and had gained 8.6%. Of the 199 funds under the study in the first quarter, 184 funds had finished in positive zone with an average gain of 3.6%. One fund had break even return, and the 14 funds that finished in the red had average loss of 1.2%. Returns from the top 15 technology funds in the first quarter were also decently above the sector’s 3% return. The average gain for these top 15 performers in first quarter was 5.7%. The average gain of the best 15 fund performers for the second quarter stood at 3.7%, a decent decline from the first quarter performance. The Tech Sector’s Q2 Scorecard (as of Jul 29) Total earnings for the 75.6% of the Tech sector’s market cap in the S&P 500 that have reported results are up 1.9% on 3.5% higher revenues, with 67.6% beating EPS estimates and 55.9% coming ahead of revenue estimates. The sector’s earnings and revenue surprises are about in-line with other historical periods, though the growth rates are notably on the weak side, despite Apple’s (NASDAQ: AAPL ) strong contribution. Once again, Apple plays a key role in the sector’s result. Taking Apple out, the technology sector’s earnings would be down 6% on 2.1% lower revenues. However, Apple’s results and guidance were not enough to impress investors this time. Revenue guidance came in short of the street. The year-over-year comps were all good (except iPad, which dropped to its lowest level in four years), but some of the sequential comps and the billion dollar capex reduction could indicate weakness. As for other key players, Intel’s results were helped by a higher gross margin, higher other income and lower tax rate. For Netflix, international revenue strength was greater than domestic, although both were up double-digits. Foreign exchange headwinds affected Google. The company has a sizeable international business, so the impact of the stronger dollar can’t always be mitigated by its hedging programs. Yahoo’s second-quarter revenue exceeded the Zacks Consensus Estimate although earnings fell short. Top 15 Technology Mutual Funds of Q2 2015 Below we present the top 15 Technology mutual funds with best returns of Q2 2015: (click to enlarge) Note: The list excludes the same funds with different classes, and institutional funds have been excluded. Funds having minimum initial investment above $5000 have been excluded. Q2 % Rank vs Objective* equals the percentage the fund falls among its peers. Here, 1 being the best and 99 being the worst. A good thing about the list is that the majority of these funds carry favorable Zacks Mutual Fund Rank . This heightens the possibility of these funds continuing their uptrend. Remember, the goal of the Zacks Mutual Fund Rank is to guide investors to identify potential winners and losers. Unlike most of the fund-rating systems, the Zacks Mutual Fund Rank is not just focused on past performance, but the likely future success of the fund. The Columbia Seligman Global Technology Fund (MUTF: SHGTX ), the T. Rowe Price Global Technology Fund (MUTF: PRGTX ), the BlackRock Science & Technology Opportunities Portfolio (MUTF: BGSAX ) and the USAA Science and Technology Fund (MUTF: USSCX ) carry a Zacks Mutual Fund Rank #1 (Strong Buy). Meanwhile, the Columbia Seligman Communications and Information Fund (MUTF: SLMCX ), the Fidelity Select Multimedia Portfolio (MUTF: FBMPX ), the Matthews Asia Science and Technology Fund (MUTF: MATFX ), the Putnam Global Technology Fund (MUTF: PGTAX ) and the Black Oak Emerging Technology Fund (MUTF: BOGSX ) currently hold a Zacks Mutual Fund Rank #2 (Buy). Among these funds, SHGTX, PRGTX, MATFX, BGSAX, USSCX had also featured in the list of best performing technology mutual funds for the first quarter. Jacob Internet Fund Inv and Firsthand Technology Opportunities have also managed to feature in both the lists. However, while JAMFX carries a Zacks Mutual Fund Rank #4 (Sell), TEFQX holds a Zacks Mutual Fund Rank #5 (Strong Sell). Funds such as the T. Rowe Price Media And Telecommunications Fund (MUTF: PRMTX ) , the Henderson Global Technology Fund (MUTF: HFGAX ) and the Baron Opportunity Fund (MUTF: BIOPX ) also carry a Zacks Mutual Fund Rank #4. Separately, the Wasatch World Innovators Fund (MUTF: WAGTX ) has a Zacks Mutual Fund Rank #3 (Hold). Link to the original post on Zacks.com

3 Unique ETFs Beating The Market

With the domestic economy recovering slowly but steadily and interest rates expected to remain low in near future, the overall backdrop for U.S. stocks remains positive. But as the bull market approaches its seven year anniversary, the easy money in stocks has already been made. Global growth worries, lackluster earnings, valuation concerns, China stock market turmoil and uncertainty relating to the Fed will also continue to weigh on the market. It is thus no surprise that the broad market continues to trade sideways with lackluster returns year-to-date. But some stocks have delivered outsized returns this year. Similarly some innovative ETFs following specialized strategies or tracking high growth areas have been rewarding their investors with stellar returns in 2015. Considering their outperformance potential, these could be held as satellite holdings in the portfolio, in order to spice up overall returns. A Shining Biotech Star: The ALPS Medical Breakthroughs ETF (NYSEARCA: SBIO ) Biotechs have been leading the bull market for the last 6-7 years. After this massive surge, valuations look lofty now by many measures, but there are still many reasons to be positive on the sector. Surging M&A activity, positive drug trial results and steady growth in the number of drugs being approved by the FDA have further boosted investor optimism and will continue to support these stocks. This fund tracks the Poliwogg Medical Breakthroughs Index. It invests mainly in mid and small cap stocks with market cap between $200 million and $5 billion. The index screens the U.S. listed biotech and pharma companies with one or more drugs in Phase II or Phase III FDA clinical trials. The index also screens for liquidity (average daily trading volume more than $1 million) and sustainability (cash for at least 2 years at their normal burn rate). Per ALPS, due to “patent cliff”, many blockbuster drugs from the 1990s and 2000s have been losing patent protection and large drug companies are struggling to replenish their pipelines. Further, due to time-consuming procedure and an alarming rate of failure for drug development, the bigger firms usually rely on new therapies processed by smaller firms that spend a lot more on R&D compared to their larger peers. This fund holds 75 stocks with Anacor Pharma (NASDAQ: ANAC ), Receptions and Horizon Pharma being the top 3 holdings. The product charges 50 bps in fees. Company specific risk is limited due to modified market cap weighting with maximum 4.5% of assets. The product launched in December last year and has gathered about $200 million in assets so far. SBIO has soared almost 52% this year. Foil Hackers with the PureFunds ISE Cyber Security ETF (NYSEARCA: HACK ) Our world is becoming increasingly digital-bringing us many exciting opportunities and possibilities–but also creating enormous challenges. Abundance of digital information and sophisticated tools available to process and share this information make it very hard to ensure data security in this interconnected world. That is why cybersecurity threats and cyberattacks are on the rise. Consequences of hacking can be huge. Further, the threat landscape has been evolving; hackers could steal not only financial data but also critical and sensitive information that could be used for criminal or extremist activities. Per Deloitte’s Q2 CFO survey, “CFOs in North America view cyberattacks as a serious threat, but many have doubts about their organization’s level of preparedness.” Surging demand for protection against these cyber threats will continue to drive demand for spending on cybersecurity. This ETF provides exposure to a diverse group of hardware and software companies in the cybersecurity industry. The product charges an expense ratio of 75 basis points. It made its debut in November last year and has already managed to gain almost $1.4 billion in assets, thanks mainly to some high profile cyberattacks of late. The ETF holds 32 securities in its portfolio and is well spread out across holdings, due to modified equal weighting methodology. Investors should however note that some of these cybersecurity stocks have been quite hot lately, leading to valuation concerns but given surging demand for these services, the ETF could be an excellent longer-term holding for investors who can ride out shorter-term volatility. The ETF is up more than 17% year-to-date. 2015 has turned out to be a pretty good year so far for hedge funds after many years of underperformance. Gains this year have been driven partly by the booming M&A activity, particularly in the healthcare sector and savvy stock selection. Most investors would like to invest like George Soros, Carl Icahn and John Paulson but the $2.9 trillion hedge fund industry is accessible only to very wealthy investors. Further, hedge fund investing is expensive as they usually charge an annual asset management fee of 2% and a performance fee of 20% of fund’s profits (2 and 2 fees). Fortunately for ordinary investors, there are some ETFs that provide access to investing secrets of such gurus, without charging the hefty fees that their funds charge. This ETF is based on the AlphaClone Hedge Fund Long/Short Index. The index uses AlphaClone’s proprietary “Clone Score” methodology to aggregate the hedge funds ideas on a quarterly basis. Clone scores, which are calculated bi-annually, are based on hedge funds managers’ performance. Index constituents are equally weighted but can have overlap bias. The index also has a hedge mechanism built in, which is triggered on or off when the S&P 500 index crosses its 200 day moving average at any month end. If the market goes down, the index goes from long-only to market hedged (50% short exposure to S&P 500). Launched in May 2012, this product has been able to attract about $195 million in assets so far. It has 86 holdings currently with Apple (NASDAQ: AAPL ), Valeant Pharmaceuticals (NYSE: VRX ) and Celgene Corp (NASDAQ: CELG ) being the top holdings. ALFA is slightly pricey, charging 95 basis points in expenses. It is up more than 8% year-to-date. Over the past three years, ALFA has climbed by 75% compared with 61% for the SPDR S&P 500 Trust ETF ( SPY). Link to the original post on Zacks.com

Dividend ETFs: Another Canary In The Coal Mine?

Bloomberg reports that money is flowing out of dividend-focused ETFs. That’s a big change after years of inflows. Pair this up with the REIT and Utility selloff, and maybe dividend investors should start getting worried. Years ago, coal miners would bring canaries into the mines with them. Not because they wanted to have a mascot around, but because canaries were more sensitive to deadly gases. When the bird died, it was time for the humans to run for the exits. Right now, the shift taking place in income-oriented stocks could be flashing just such a warning sign. Who doesn’t love an ETF? According to Bloomberg , Vanguard Dividend Appreciation ETF (NYSEARCA: VIG ) has seen more money flow in its doors every year since it was created in 2006. Until this year, that is. Roughly $800 million has left the roughly $20 billion fund so far in 2015. And VIG isn’t alone. According to Bloomberg the dividend ETF category, with about $100 billion in assets, has seen roughly $2 billion in outflows this year. Now that’s not a huge amount of money percentage wise, but it’s a clear indication that the popularity of dividend ETFs is waning. And that’s a big deal. But what’s going on? For starters, as the Federal Reserve has talked about raising short-term interest rates, the market has already started the process. The rate on 10-year treasuries has inched up from 1.6% to 2.3% this year. VIG yields around 2.2%. Why take the risk of owning stocks if you can get the same yield from a treasury? And to add insult to injury, VIG is down roughly 2% so far this year while sibling Vanguard S&P 500 ETF (NYSEARCA: VOO ) is up about 2%. VOO yields around 2%, for comparison. So VIG is lagging the broader market and it doesn’t offer much of a yield advantage compared to the S&P 500 Index. Once again, why bother with VIG? Bigger picture But that’s not the whole picture. For example, real estate investment trusts have also fallen out of favor. Vanguard REIT Index ETF (NYSEARCA: VNQ ) is down around 4% so far this year and roughly 12% from its early year highs. And Vanguard Utilities ETF (NYSEARCA: VPU ) is down roughly 11% this year and nearly 15% from its early year highs. So dividend ETFs aren’t the only ones facing performance headwinds. Note that market watchers have commented on the asset outflows from these two funds this year, too. The take away is that sectors of the market that are associated with dividend investing aren’t the bright spots they once were. They are lagging and seeing investor outflows. And it’s worth noting that VNQ and VPU both have higher yields than the 10-year treasury. So investor flight is about more than just yield. The most likely reason for all of this bad news is investor sentiment. And that’s a potentially dangerous thing if it starts to snowball. At that point it could easily turn into an avalanche of selling. Remember Benjamin Graham’s Mr. Market isn’t sane, the prices he offers sometimes appear ridiculously high and ridiculously low. This is just another way of explaining the pendulum nature of the market, in which prices move back and forth from the extremes. Over long periods, the prices may make sense, but over short periods that’s not really the case. The next shoe to drop? There’s no way to tell, of course, what might cause what’s happening to dividend-focused investments to turn into an avalanche. However, there’s a pretty big issue coming to a head right now: the Fed and short-term rates. Some suggest that any rate hike will be small so it will have little impact on companies. And, thus, should lead to little change in stock prices. You could also argue that any hike will be driven by economic improvement, though I’d argue that the economy is hardly robust and stable right now. But these counter arguments miss the emotional impact, which is what drives stock prices over short periods of time. And it also ignores the multi-year run up in the prices of dividend-focused investments. For example, despite their recent pull backs, VIG, VNQ, and VPU are up still up roughly 70%, 55%, and 40%, respectively, over the past five years. That’s down from early year highs and you could easily argue that the declines so far this year for REITs and utilities have brought at least these two sectors back into buying territory. This thesis, however, ignores the usual market pendulum from extreme to extreme. Yes, the pendulum swings through rational, but that normally happens as it’s swinging to the other extreme. In other words, I don’t think now is the time to be aggressive. I think caution is still in order. And until the Fed actually starts raising rates, uncertainty will be your enemy. So I think the canaries are starting to choke. Perhaps it’s not time to exit the mines just yet, but I’d sure be making plans to do so if you own anything speculative. Disclosure: I/we have no positions in any stocks mentioned, and no plans to initiate any positions within the next 72 hours. (More…) I wrote this article myself, and it expresses my own opinions. I am not receiving compensation for it (other than from Seeking Alpha). I have no business relationship with any company whose stock is mentioned in this article.