Tag Archives: mutual funds

Best And Worst Q3’15: Information Technology ETFs, Mutual Funds And Key Holdings

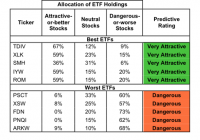
Summary Information Technology sector ranks second in Q3’15. Based on an aggregation of ratings of 28 ETFs and 129 mutual funds. TDIV is our top-rated Information Technology ETF and ROGSX is our top-rated Information Technology mutual fund. The Information Technology sector ranks second out of the 10 sectors as detailed in our Q3’15 Sector Ratings for ETFs and Mutual Funds report. It gets our Neutral rating, which is based on an aggregation of ratings of 28 ETFs and 129 mutual funds in the Information Technology sector as of July 9, 2015. See a recap of our Q2’15 Sector Ratings here . Figures 1 and 2 show the five best and worst-rated ETFs and mutual funds in the sector. Not all Information Technology sector ETFs and mutual funds are created the same. The number of holdings varies widely (from 23 to 397). This variation creates drastically different investment implications and, therefore, ratings. Investors seeking exposure to the Information Technology sector should buy one of the Attractive-or-better rated ETFs or mutual funds from Figures 1 and 2. Figure 1: ETFs with the Best & Worst Ratings – Top 5 (click to enlarge) * Best ETFs exclude ETFs with TNAs less than $100 million for inadequate liquidity. Sources: New Constructs, LLC and company filings Figure 2: Mutual Funds with the Best & Worst Ratings – Top 5 (click to enlarge) * Best mutual funds exclude funds with TNAs less than $100 million for inadequate liquidity. Sources: New Constructs, LLC and company filings The First Trust NASDAQ Technology Dividend Index ETF (NASDAQ: TDIV ) is the top-rated Information Technology ETF and the Red Oak Technology Select Fund (MUTF: ROGSX ) is the top-rated Information Technology mutual fund. Both earn a Very Attractive rating. The ARK Web x.0 ETF (NYSEARCA: ARKW ) is the worst-rated Information Technology ETF and The Rydex Internet Fund (MUTF: RYINX ) is the worst-rated Information Technology mutual fund. ARKW earns a Dangerous rating and RYINX earns a Very Dangerous rating. 527 stocks of the 3000+ we cover are classified as Information Technology stocks. Cisco Systems, Inc. (NASDAQ: CSCO ), a previous Stock Pick of the Week, is one of our favorite stocks held by TDIV and earns our Very Attractive rating. Since 2005, Cisco has grown after-tax profit ( NOPAT ) by 6% compounded annually. Cisco earns a top-quintile return on invested capital ( ROIC ) of 16% and has steadily become a free cash flow machine, generating $9.5 billion on a trailing-twelve month (TTM) basis. Fears of Cisco’s demise in a new age of technology have long kept the stock undervalued. At its current price of ~$28/share, Cisco has a price to economic book value ( PEBV ) of 0.9. This ratio implies the market expects Cisco’s profits to permanently decline by 10%. However, if Cisco can grow NOPAT by 5% compounded annually over the next decade , the stock is worth $36/share – a 28% upside. Proofpoint Inc. (NASDAQ: PFPT ) is one of our least favorite stocks held by ARKW and earns our Dangerous rating. Proofpoint is similar to many of our recent Danger Zone picks in that it touts high revenue growth but negative profits. From 2012-2014, Proofpoint grew revenue by 23% compounded annually. On the other hand, NOPAT declined from -$19 million to -$47 million. On a TTM basis, which includes 1Q15 results, NOPAT has fallen to -$52 million. Proofpoint’s pre-tax (NOPBT) margins are -26% and the company currently earns a bottom-quintile ROIC of -53%. The stock price has benefited from the hype surrounding cyber security companies and is now significantly overvalued. To justify its current price of $63/share, Proofpoint must immediately achieve 6% NOPBT margins (similar to peer Fortinet (NASDAQ: FTNT )) and grow revenues by 30% compounded annually for the next 16 years . If you want to be in a stock that benefits from the growth in cyber security, we recommend this recent stock pick of the week. Figures 3 and 4 show the rating landscape of all Information Technology ETFs and mutual funds. Figure 3: Separating the Best ETFs From the Worst ETFs (click to enlarge) Sources: New Constructs, LLC and company filings Figure 4: Separating the Best Mutual Funds From the Worst Mutual Funds (click to enlarge) Sources: New Constructs, LLC and company filings D isclosure: David Trainer and Max Lee receive no compensation to write about any specific stock, sector or theme. Disclosure: I/we have no positions in any stocks mentioned, and no plans to initiate any positions within the next 72 hours. (More…) I wrote this article myself, and it expresses my own opinions. I am not receiving compensation for it. I have no business relationship with any company whose stock is mentioned in this article.
REIT CEFs: What Should You Be Looking At Now?

REIT stocks have taken a hit of late. That’s left REIT CEFs suffering, too. Is now the time to buy in and what kind of REIT CEF’s look best? I decided to look at two intertwined questions based on reader comments to an article I wrote about RMR Real Estate Income Fund (NYSEMKT: RIF ): First, is the REIT sell off over? And Second, what are the best priced REIT CEFs right now? No rush To start with, I don’t think REIT stocks are cheap right now. They are certainly cheaper than they were earlier in the year, but that doesn’t make them a good value. I outlined my concerns in a recent article, which you should read for more depth. But I’ll summarize: Demand for REITs, and other income oriented investments, has been driven by the historically low interest rate environment engineered by the Federal Reserve. That can’t last forever and with the Fed talking about a rate increase, the recent sell off is a sign that investors are getting spooked. And that’s what makes me believe there’s a good possibility for more downside from here. Investor sentiment is what drives market prices over the near term. But investor sentiment moves like a pendulum, going from extreme to extreme. Sure we’ve pulled away from REITs being overvalued and loved by all. But my guess is that we’re just passing through something that approximates fair value right now on our way to the other side, where REITs will be out of favor. That, however, is just my opinion. Brad Thomas, who writes the Intelligent REIT Investor for Forbes, for example, counters that, suggesting that now is a good time to be looking at REITs. That said, he isn’t calling for investors to back up the truck and load up. He suggests what he calls a “patient hand.” Or, more specifically, dollar cost averaging so you don’t put all your capital at risk. In the end, however, Brad and I both agree that REITs can be a great benefit to a portfolio, providing income and diversification. And, frankly, I’m the first to admit that if you need income now, sitting on the sidelines isn’t a workable investment strategy. So, you may, indeed, be in the market now for REITs right now. Clearly sticking with industry leaders is a good call. But outsourcing to a dedicated REIT manager is also an interesting option. And that’s where I’ve seen some readers asking about closed-end funds. What REIT CEFs are good? You could, of course, purchase an open-end fund to get your exposure to REITs. But that means you’ll be paying market price, since open-end funds have to trade at net asset value, or NAV, at all times. Exchange traded funds also tend to trade at or very close to NAV and are often just index offerings. Closed-end funds, on the other hand, are actively managed and frequently trade at a discount to their NAVs. And that’s driven by investor sentiment. When investors are pessimistic, discounts widen. And they are extra wide at a number of REIT CEFs right now. That will boost yields and potentially provides some downside protection (a margin of safety, if you will) if REIT prices fall further-After all, you paid a below market price. But all CEFs aren’t the same and you need to know what you are buying. For example, RIF, which I wrote about recently , is trading with a very large 20% discount to NAV. Its three-year average is around 14.5%. The CEF owns a portfolio of REITs and REIT preferred stocks, almost like a balanced fund, in a way, and sports a yield of around 6.9%. But, you’ll want to keep a few things in mind. First, RIF uses leverage. Leverage stood at about 30% of assets as recently as the end of March. Leverage is great in up markets because it enhances return, but can be damaging in down markets because it exacerbates losses. If you are looking at a REIT CEF, take leverage into consideration. Second, RMR is the fund’s manager. Although this company runs a few public REITs, you may or may not be comfortable with their managing history. That’s where a fund like Cohen & Steers REIT and Preferred Income Fund (NYSE: RNP ) might come in. Like RIF, RNP mixes REITs with REIT preferred stocks and uses leverage (around 25% of assets). Also like RIF, RNP is trading at a wider discount than usual: RNP’s discount is around 17% compared to its three-year average of nearly 11%. However, Cohen & Steers was one of the first asset managers to specialize in REITs and is highly respected in the industry. If you are concerned about RMR but like the idea of RIF, Cohen & Steer’s RNP would be a good alternative. RNP’s distribution yield of 8.3% also offers more income to investors. That said, there’s a reason why these two funds have among the widest discounts in the REIT CEF space: Preferred stocks are likely to take a hit if rates go higher because they are similar in many ways to a bond. Add in leverage and you can see that these CEFs might be riskier then they first appear. And why investors are asking for such notable discounts relative to other REIT CEFs. And that’s why you might prefer a fund like Cohen & Steers Total Return Realty Shares (NYSE: RFI ), which yields around 7.6%, in between the two above REIT CEFs. RFI invests only in REIT stocks and doesn’t use any leverage. That said, its discount is only about 9%. So you aren’t getting as good a deal on an absolute basis. But what about on a relative basis? Total Return Realty Shares’ average discount over the past three years is around 3%, so it’s actually trading much further below its historical range than either RIF or RNP. So, relatively speaking, RFI could be the better deal and it has a lower risk profile. Not the only options This trio of funds obviously aren’t the only RIET CEF options. But they show pretty clearly some of the things you’ll want to look at beyond a steep absolute discount, including management, portfolio structure, use of leverage, and relative discount. I personally like Cohen & Steers as a company and right now I’d suggest pulling back on risk for most investors. Thus, I think starting your research with an unleveraged pure play like RFI is a good idea if you are looking to outsource your REIT exposure. You might decide you are willing to take on more risk, and that’s fine. Just make sure you understand that risk, and the alternatives you have, before you take it. Disclosure: I/we have no positions in any stocks mentioned, and no plans to initiate any positions within the next 72 hours. (More…) I wrote this article myself, and it expresses my own opinions. I am not receiving compensation for it (other than from Seeking Alpha). I have no business relationship with any company whose stock is mentioned in this article.

TIAA-CREF Lifestyle Conservative Fund, August 2015

Objective and strategy The TIAA-CREF Lifestyle Conservative Fund (MUTF: TSCLX ) seeks long-term total return, consisting of both current income and capital appreciation. It is a “fund of funds” that invests in the low-cost Institutional Class shares of other TIAA-CREF funds. It is designed for investors targeting a conservative risk-return profile. In general, 40% of the fund’s assets are invested in stocks and 60% in bonds. The managers can change those allocations by as much as 10% up or down depending upon current market conditions and outlook. Adviser TIAA-CREF. It stands for “Teachers Insurance and Annuity Association – College Retirement Equities Fund,” which tells you a lot about them. They were founded in 1918 to help secure the retirements of college teachers; their original backers were Andrew Carnegie and his Carnegie Foundation. Their mission eventually broadened to serving people who work in the academic, research, medical and cultural fields. More recently, their funds became available to the general public. TIAA-CREF manages almost $900 billion dollars for its five million investors. Because so much of their business is with highly-educated professionals concerned about their retirement, TIAA-CREF focuses on fundamentally sound strategies with little trendiness or flash and on keeping expenses as lower as possible. 70% of their investment products have earned four- or five-star ratings from Morningstar and the company is consistently rated as one of America’s best employers. Manager John Cunniff and Hans Erickson, who have managed the fund since its inception. Management’s stake in the fund We generally look for funds where the managers have placed a lot of their own money to work beside yours. Mssrs. Cunniff and Erickson each have $500,001 – $1,000,000 invested in the fund, which qualifies as “a lot.” Opening date December 9, 2011. Many of the funds in which the managers invest are much older than that. Minimum investment $2,500. That is reduced to $100 if you sign up for an automatic investing plan. Expense ratio 0.87% on $115 million in assets, as of July 2015. That’s about average for funds of this type. Comments Lifestyle Conservative offers many of the same attractions as the Vanguard Star Fund (MUTF: VGSTX ) but does so with a more conservative asset allocation. Here are three arguments on its behalf. First, the fund invests in a way that is broadly diversified and pretty conservative . 40% of its money is invested in stocks, 40% in high-quality bonds and the last 20% in short-term bonds. That’s admirably cautious. They then take measured risks within their various investments (for example, their stock portfolio is more tilted toward international stocks and emerging markets stocks than are their peers) to help boost returns. Second, TIAA-CREF is very good. There are two sorts of funds, those which simply buy all of the stocks or bonds in a particular index without trying to judge whether they’re good or bad (these are called “passive” funds) and those whose managers try to invest in only the best stocks or bonds (called “active” funds). TSCLX invests in a mix of the two with active funds receiving about 90% of the cash. CREF’s management teams tend to be pretty stable (the average tenure is close to nine years); most managers handle just one or two funds and most invest heavily (north of $100,000 per manager per fund) in their funds. CREF and its funds operate with far lower expenses than its peers, on average, 0.43% per year for funds investing primarily in U.S. stocks. Even their most expensive fund charges 40% less than their industry peers. Every dollar not spent on running the fund is a dollar that remains in your account. Third, Lifestyle Conservative is a very easy way to build a very well-diversified portfolio. Lifestyle Conservative builds its portfolio around 15 actively-managed and three passively-managed TIAA-CREF funds. They are: Which invests in Large-Cap Growth Large companies in new and emerging areas of the economy that appear poised for growth. Large-Cap Value Large companies, mostly in the U.S., whose stock is undervalued based on an evaluation of their potential worth. Enhanced Large-Cap Growth Index Quantitative models try to help it put extra money into the most attractive stocks in the U.S. Large Cap Growth index; it tries to sort of “tilt” a traditional index. Enhanced Large-Cap Value Index Quantitative models try to help it put extra money into the most attractive stocks in the U.S. Large Cap Value index. Mid-Cap Growth Medium-sized U.S. companies with strong earnings growth. Mid-Cap Value Temporarily undervalued mid-sized companies. Growth & Income Large U.S. companies which are paying healthy dividends or buying back their stock. Small-Cap Equity smaller domestic companies across a wide range of sectors, growth rates and valuations. International Equity Stocks of stable and growing non-U.S. companies. International Opportunities Stocks of foreign firms that might have great potential but a limited track record. Emerging Markets Equity Stocks of firms located in emerging markets such as India and China. Enhanced International Equity Index Quantitative models try to help it put extra money into the most attractive stocks in the International Equity index. Global Natural Resources Firms around the world involved in energy, metals, agriculture and other commodities. Bond High quality U.S. bonds. Bond Plus 70% investment grade bonds and 30% spicier fare, such as emerging markets bonds or high-yield debt. High-Yield Mostly somewhat riskier, higher-yielding bonds for U.S. and foreign corporations. Short-Term Bond Short-term, investment grade U.S. government and corporate bonds. Money Market Ultra-safe, lower-returning CDs and such. Bottom Line Lifestyle Conservative has been a fine performer since launch. It has returned 7.5% annually over the past three years. That’s about 2% per year better than average, which places it in the top 20% of all conservative hybrid funds. While it trails more venturesome funds such as Vanguard STAR in good markets, it holds up substantially better than they do in falling markets. That combination led Morningstar to award it four stars, their second-highest rating.