Tag Archives: mutual funds

VDADX: A Great Mutual Fund That Is Remarkably Low On 2 Key Sectors

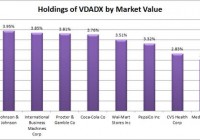
Summary VDADX offers investors a great start to building a dividend portfolio. The fund is missing almost all exposure to the utility sector and to oil and gas. The expense ratio is exceptionally low, and the historical volatility has been better than that of the market. Investors should be seeking to improve their risk-adjusted returns. I’m a big fan of using ETFs to achieve the risk-adjusted returns relative to the portfolios that a normal investor can generate for themselves after trading costs. Despite my frequent use of ETFs in my personal investing, many retirement accounts still use mutual funds as a major source of their investing. When it comes to assessing the mutual funds, one of my earlier favorites is the Vanguard Dividend Appreciation Index Fund (MUTF: VDADX ). Largest Holdings I’m starting the analysis by looking at the largest holdings in VDADX. As you can guess from the name, there is a heavy emphasis on receiving dividends from the portfolio. (click to enlarge) The holdings are a little on the heavily concentrated side with several holdings over 3%, and it is interesting that the fund opted to include heavyweights on both Coke (NYSE: KO ) and Pepsi (NYSE: PEP ). However, I don’t see any real disadvantage to holding both for better diversification since the investor won’t be stuck paying trading costs to buy each individually. The thing that really stands out to me is that there is no Exxon Mobil (NYSE: XOM ) or Chevron Corporation (NYSE: CVX ) in the top 10. XOM is yielding over 3.5% and CVX is up near 5%. That really concerns me. Though I did not chart the rest of the top 100 holdings, I did scan through them looking for Exxon or Chevron. Neither was included anywhere in the top 100 holdings. Granted oil prices are plummeting and oil stocks may seem “risky”, but a small inclusion would be entirely appropriate for a portfolio focused on dividends. The yields are high, and the companies would benefit from higher gas prices while many parts of the economy would be disadvantaged by high fuel prices. For diversification purposes, it is very strange not to have them included. On the other hand, Vanguard is including quite a few other holdings that I wouldn’t put at the top of the list for a fund focused on dividends. For instance, Costco (NASDAQ: COST ) is included in the portfolio despite having a yield of only 1.09%. There is nothing wrong with Costco as a company from my perspective, but the portfolio already has quite a bit of retail exposure and is lacking in the big gas companies. Diversification Benefits The correlation to SPY is just under 97%, so diversification benefits are not very substantial. However, the volatility on the fund is materially lower at only 87% of the level on SPY, which is nice for investors who would prefer more stability in their portfolio values. Yield & Taxes The SEC yield is 2.19%. Again, this feels fairly low for a dividend portfolio and brings me back to the question of why companies like Chevron were not given a prominent weighting in the portfolio. Expense Ratio The mutual fund is posting an expense ratio of .10%. I want diversification, I want stability, and I don’t want to pay for them. An expense ratio of .10% is absolutely beautiful and makes VDADX a solid choice for investors. Sector Allocations To go a little deeper into the absence of the major oil companies I like to see included in a dividend growth portfolio, I grabbed a chart of the sector allocations. (click to enlarge) As you can see, the oil and gas sector was only 1.3% for the fund. That matches the index that the fund is tracking; however, I find it interesting that the index was designed to limit the exposure to oil and gas. If I were establishing a dividend index for a fund that could be used as a major portion of an investor’s portfolio, I would want to increase the oil and gas weightings to around 10%. The other interesting factor is that utilities are also mostly absent. Unless the investors are buying utility companies themselves, the ideal allocation, in my opinion, would include a higher weighting for utilities in the 10% to 15% range. Conclusion For investors looking at the very long-term picture, the extremely low expense ratio is beautiful. Vanguard has been one of the best in the business at creating low-fee mutual funds. I don’t think a fund should be chosen purely for the expense ratio, but I do believe investors should be very aware of it. When I’m putting together hypothetical portfolio positions, one of the things I include is the expense ratio on the individual positions to track the overall expense ratio on the portfolio. The overall portfolio looks solid with the exception that oil and gas is largely absent and the utility sector is strangely underrepresented despite several utility companies having strong yields. If I were using VDADX as a core holding in my retirement accounts, I would want to complement it with specifically increasing allocations to large-cap oil and gas companies and a geographically diversified group of utility companies. Disclosure: I/we have no positions in any stocks mentioned, and no plans to initiate any positions within the next 72 hours. (More…) I wrote this article myself, and it expresses my own opinions. I am not receiving compensation for it (other than from Seeking Alpha). I have no business relationship with any company whose stock is mentioned in this article. Additional disclosure: Information in this article represents the opinion of the analyst. All statements are represented as opinions, rather than facts, and should not be construed as advice to buy or sell a security. Ratings of “outperform” and “underperform” reflect the analyst’s estimation of a divergence between the market value for a security and the price that would be appropriate given the potential for risks and returns relative to other securities. The analyst does not know your particular objectives for returns or constraints upon investing. All investors are encouraged to do their own research before making any investment decision. Information is regularly obtained from Yahoo Finance, Google Finance, and SEC Database. If Yahoo, Google, or the SEC database contained faulty or old information it could be incorporated into my analysis.

ABR Dynamic Funds Launches Tactical Equity And Volatility Fund

By DailyAlts Staff On August 3, ABR Dynamic Funds launched a new liquid alternative mutual fund: The ABR Dynamic Blend Equity & Volatility Fund (MUTF: ABRVX ). The fund joins a growing list of funds that utilize volatility as an asset class, and will do so using a model-driven investment approach to tactically allocate its assets between equities, equity volatility, and cash. Typically, the ABR Dynamic Blend Equity & Volatility Fund will invest at least 80% of its assets in equities and equity-related derivatives, with total holdings split between three sleeves: Equities (i.e., instruments that track the S&P 500); Equity volatility (i.e., instruments that track the S&P 500 VIX short-term futures); and Cash (i.e., cash and cash equivalents). The index that the fund tracks is designed to capture favorable volatility movements in the equity markets while maintaining equity exposure to preserve positive performance during extended periods of rising markets. Objective & Approach The ABR Dynamic Blend Equity & Volatility Fund’s investment objective is to provide results that generally correspond to the ABR Dynamic Blend Equity & Volatility Index, as calculated by Wilshire; a benchmark index that measures the returns of a “dynamic ratio” of large-cap stocks and the volatility of large-cap stocks. In other words, the ratio of stocks, equity volatility and cash isn’t static over time. This is explained in the prospectus as follows: The Fund is systematically rebalanced once daily to replicate the ratio of the Index’s exposure to the S&P 500 Total Return Index, the S&P 500 VIX Short-Term Futures Index, and cash based on the investment model’s assessed volatility in the market and the historic returns of the underlying indexes. The Fund’s exposure to the S&P 500 Total Return Index increases in periods of relatively low market volatility, as determined by the Index, which reflects the investment model and compared to historic levels of market volatility. During periods of extremely low volatility in the equity markets, the Fund’s exposure to the S&P 500 Total Return Index may approach 100%. The Fund’s exposure to the S&P 500 VIX Short-Term Futures Index increases in periods of relatively high volatility. During periods of extremely high volatility in the equity markets, the Fund’s exposure to the S&P 500 VIX Short-Term Futures Index may approach 50%. The prospectus also notes that the fund “may also convert to a full cash position as necessary to remain consistent with the cash position weighting of the Index,” but doesn’t make it clear as to what type of market environment would trigger a move to cash. Management & Share Classes ABR Dynamic Funds is the fund’s investment advisor, and the firm’s Taylor Lukof and David Skordal are its portfolio managers. Mr. Lukof is the founder and CEO of Dynamic Funds and also CIO of ABR Management. Mr. Skordal is an accomplished professional trader turned portfolio manager with a dozen years of experience in the investment industry. Together, the two men are charged with the task of the day-to-day management of the new fund. Shares of the ABR Dynamic Blend Equity & Volatility Fund are available in investor (MUTF: ABRTX ) and institutional classes. Investment management fees are 1.75% Investor shares have a net-expense ratio of 2.25% and a minimum initial investment of $2,500 Institutional-class shares have a net-expense ratio of 2.00% and an initial minimum of $100,000. For more information, visit the advisor’s website . Share this article with a colleague

Best And Worst Q3’15: All Cap Blend ETFs, Mutual Funds And Key Holdings

Summary The All Cap Blend style ranks third in Q3’15. Based on an aggregation of ratings of 66 ETFs and 675 mutual funds. DGRW is our top-rated All Cap Blend ETF and MFVZX is our top-rated All Cap Blend mutual fund. The All Cap Blend style ranks third out of the 12 fund styles as detailed in our Q3’15 Style Ratings for ETFs and Mutual Funds report. It gets our Neutral rating, which is based on aggregation of ratings of 66 ETFs and 675 mutual funds in the All Cap Blend style. See a recap of our Q2’15 Style Ratings here. Figure 1 and 2 show the five best and worst-rated ETFs and mutual funds in the style. Not all All Cap Blend style ETFs and mutual funds are created the same. The number of holdings varies widely (from 4 to 3794). This variation creates drastically different investment implications and, therefore, ratings. Investors seeking exposure to the All Cap Blend style should buy one of the Attractive-or-better rated ETFs or mutual funds from Figures 1 and 2. Figure 1: ETFs with the Best & Worst Ratings – Top 5 (click to enlarge) * Best ETFs exclude ETFs with TNAs less than $100 million for inadequate liquidity. Sources: New Constructs, LLC and company filings The ValueShares U.S. Quantitative Value ETF (BATS: QVAL ) is excluded from Figure 1 because its total net assets are below $100 million and do not meet our liquidity minimums Figure 2: Mutual Funds with the Best & Worst Ratings – Top 5 (click to enlarge) * Best mutual funds exclude funds with TNAs less than $100 million for inadequate liquidity. Sources: New Constructs, LLC and company filings The Walden Asset Management Fund (MUTF: WSBFX ) and the Jensen Quality Value Fund ( JNVIX , JNVSX ) are excluded from Figure 2 because their total net assets are below $100 million and do not meet our liquidity minimums. The WisdomTree U.S. Dividend Growth ETF (NASDAQ: DGRW ) is the top-rated All Cap Blend ETF and the MassMutual Select Focused Value Fund (MUTF: MFVZX ) is the top-rated All Cap Blend mutual fund. Both earn a Very Attractive rating. The PowerShares FTSE RAFI US 1500 Small-Mid Portfolio ETF (NASDAQ: PRFZ ) is the worst-rated All Cap Blend ETF and the Forward Dynamic Income Fund (MUTF: FDYAX ) is the worst-rated All Cap Blend mutual fund. PRFZ earns a Dangerous rating and FDYAX earns a Very Dangerous rating. Intel Corporation (NASDAQ: INTC ), is one of our favorite stocks held by All Cap Blend funds and earns our Very Attractive rating. Since 2009, Intel has grown after-tax profit (NOPAT) by 13% compounded annually. Much of this NOPAT growth can be attributed to Intel maintaining NOPAT margins upwards of 18% every year since 2008. The company currently earns a top-quintile return on invested capital ( ROIC ) of 21%, which is a slight improvement from 17% in 2013. Despite the fundamental strength of the business, the stock remains undervalued. At its current price of ~$29/share, Intel has a price to economic book value ( PEBV ) ratio of 0.8. This ratio implies that the market expects Intel’s NOPAT to permanently decline by 20%. If the company can grow NOPAT by just 3% compounded annually over the next ten years , the stock is worth $42/share – a 45% upside. Arbor Realty Trust, Inc. (NYSE: ABR ) is one of our least favorite stocks held by All Cap Blend funds and earns our Dangerous rating. Arbor Realty Trust never quite recovered from the financial crisis in 2008 and NOPAT has declined 55% compounded annually ever since. As opposed to Intel, Arbor Realty Trust has been unable to preserve its once-impressive NOPAT margin of 25% achieved in 2008 as it has since declined to 0.5% in 2014. The market has overlooked the declining nature of the business in favor of focusing on ABR’s 9% dividend yield. To justify its current price of $6/share, Arbor Realty Trust must grow NOPAT 29% compounded annually over the next 17 years . Almost no level of dividend yield can protect investors from the capital loss that would occur if ABR traded at its economic book value of ~$1/share. Figures 3 and 4 show the rating landscape of all All Cap Blend ETFs and mutual funds. Figure 3: Separating the Best ETFs From the Worst Funds (click to enlarge) Sources: New Constructs, LLC and company filings Figure 4: Separating the Best Mutual Funds From the Worst Funds (click to enlarge) Sources: New Constructs, LLC and company filings D isclosure: David Trainer and Max Lee receive no compensation to write about any specific stock, style, style or theme. Disclosure: I/we have no positions in any stocks mentioned, and no plans to initiate any positions within the next 72 hours. (More…) I wrote this article myself, and it expresses my own opinions. I am not receiving compensation for it. I have no business relationship with any company whose stock is mentioned in this article.