Tag Archives: mutual funds

Add These Investment-Grade Bond Funds To Your Portfolio

Bonds are assigned ratings based on credit quality. Bond rating firms, like Standard & Poor’s, assign the ratings using upper- and lower-case letters. Usually, “AAA” and “AA” (high credit quality) and “A” and “BBB” (medium credit quality) are the investment-grade bonds. Government bonds, or Treasuries, are not assigned any rating. They generally qualify as the highest credit-quality bonds. A downgrade of a company’s bonds from “BBB” to “BB” reclassifies the debt to “junk” from investment-grade. These can negatively affect bond prices, and the effect of even a one-step drop in quality is problematic for the issuer. Bond funds, however, are a good investment during a low-rate environment. Below, we will share with you 5 buy-ranked Investment-Grade Bond mutual funds. These may be Investment-Grade Bond – Long, Investment-Grade Bond – Intermediate, Investment-Grade Bond – Miscellaneous or Investment-Grade Bond – Short. Each has earned a Zacks Mutual Fund Rank #1 (Strong Buy) or a Zacks Mutual Fund Rank #2 (Buy) , as we expect these mutual funds to outperform their peers in the future. Putnam Absolute Return 700 Fund Inst (MUTF: PDMYX ) seeks to earn 700 basis points, or 7% higher return than U.S. Treasury bills. This higher return of 7% is on an annualized basis, generally over a minimum of 3 years under any market condition. PDMYX combines beta strategy and alpha strategy to seek consistent absolute return. The beta independent investment strategy provides exposure to the investment markets, while the alpha strategy pursues returns from active trading. PDMYX has a 3-year annualized return of 5.3%. The annual expense ratio for Putnam Absolute Return 700 Y is 0.99%, lower than the category average of 1.70%. John Hancock Funds Strategic Income Opportunities Fund C (MUTF: JIPCX ) invests a minimum of 80% of its assets – foreign government and corporate debt securities, U.S. government and agency securities, domestic high-yield bonds, and investment-grade corporate bonds and currency instruments. These may be foreign currency- or US dollar-denominated. JIPCX has a 3-year annualized return of 3.4%. Daniel Janis is the fund manager and has managed JIPCX since 2006. American Funds Intermediate Bond Fund of America Retirement (MUTF: RBOGX ) seeks current income in tune with the quality and maturity standards mentioned in its prospectus. The fund mostly invests in bonds and other debt securities having ratings of A- or better or A3 or better. The bonds, debt securities and money market instruments will have dollar-weighted average effective maturity of at least three years and a maximum of five years. RBOGX has a 3-year annualized return of 1.1%. As of June 2015, RBOGX held 510 issues, with 1.36% of its total assets invested in Canada Govt. 1.5%. Vanguard Intermediate-Term Investment Grade Fund Inv (MUTF: VFICX ) invests a majority of its assets in fixed-income securities of high quality. A large proportion of the securities held are short- and intermediate-term securities rated investment-grade. The average maturity period of the fund ranges from five to ten years. VFICX has a 3-year annualized return of 2.6%. The annual expense ratio for Vanguard Intermediate-Term Investment-Grade is 0.20%, lower than the category average of 0.87% Oppenheimer Core Bond Fund Inst (MUTF: OPBYX ) seeks total return. It invests a large chunk of its assets in investment-grade debt securities. A maximum of 20% of OPBYX’s assets may be invested in junk bonds. Not more than 20% of assets will be invested in foreign debt securities. The fund has a 3-year annualized return of 3.4%. Krishna K. Memani is the fund manager and has managed OPBYX since 2009. Original Post
Using Attribution Analysis To Gain Perspective On Actively Managed Funds

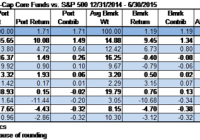
Much has been written about the mass exodus of investors from large-cap actively managed funds over the last several years. For 2014 alone, despite a relatively strong one-year return from the group (+10.72%), investors redeemed some $34.5 billion from actively managed large-cap funds, while they padded the coffers of passively managed funds (+$17.4 billion). Nonetheless, the actively managed large-cap funds group is still the largest group in the equity universe, with $1.6 trillion under management, while its passively managed brethren (excluding S&P 500 Index funds) have a little over $335 billion under management. Although on average passively managed funds have recently outpaced their actively managed counterparts, there are certain times when actively managed funds do indeed outperform. When bull markets start to lose steam and stock picking comes back into vogue or when markets are in a funk, research has shown that actively managed funds are often poised to post better returns than their passively managed counterparts. Year to date through June 30, 2015, in the current sideways market actively managed large-cap funds (+1.95%) have outperformed passively managed (pure index) large-cap funds (+1.33%). Since the performance of active and passive strategies runs in cycles, it’s important to set expectations for clients. To help explain performance trends of actively managed funds vis-à-vis their benchmarks, it’s useful to dive deeper into portfolio practice. For the remainder of this segment we’ll focus on Lipper’s Large-Cap Core Funds (LCCE) classification using attribution-analysis tools. Attribution analysis gives us a way to assign performance qualities to the manager’s portfolio allocation choices (that is, under- or over-allocation to a particular industry, which is referred to as the allocation effect) and to the manager’s stock selection decisions (the selection effect) compared to the composition of the benchmark’s holdings. For 2014, ignoring the impact of expenses on returns, the average actively managed LCCE fund (+13.13%) underperformed the S&P 500 daily reinvested composite (+13.65%) by 52 basis points (bps). In our initial deep dive we note that the average actively managed LCCE fund lagged the benchmark by 2 bps because of allocation effect, while stock selection led to underperformance of 50 bps. In particular, an over-allocation to poorly performing stocks in the finance sector (e.g., Genworth Financial (NYSE: GNW ), Standard Charter ( OTCPK:SCBFF ), and Ocwen Financial (NYSE: OCN )) weighed heavily on active LCCE funds compared with the benchmark, with an economic sector selection effect of minus 51 bps. On the flipside a slight overweighting in consumer discretionary stocks with superior stock returns within the subgroup compared to the benchmark helped the average actively managed LCCE funds’ return, adding 29 bps to the total effect (allocation effect and selection effect combined). However, so far in 2015-and again ignoring expenses-the average actively managed LCCE fund (+1.71%) has outpaced its benchmark (+1.19%) by 52 bps (+28 bps allocation effect and +23 bps selection effect). The average actively managed LCCE fund was slightly over-allocated to healthcare stocks compared to the S&P 500 Index’s allocation, boosting the comparative return 5 bps, while the average portfolio manager’s stock-picking abilities in this sideways market added some 9 bps to the overall return. (click to enlarge) Source: Lipper, a Thomson Reuters company In the analysis above fund expenses are not included in order to provide a true apples-to-apples comparison. This analysis is based on portfolio construction, comparing allocation and stock picking impacts before the consideration of expenses, which are generally easy to assess. Once the trend of the group is found, it is an easy mathematical exercise to slot in expenses. This type of review helps us isolate the pros and cons of various fund groups or individual funds. Attribution analysis can be used as well to highlight funds with superior and inferior performance within a classification, and it can provide a clear explanation of why those findings occurred. As an example, we have identified one of the best performing funds in the LCCE classification over the one-year period ended June 30, 2015, and have run it through attribution analysis to find out how it achieved its outperformance. While this is not a substitution for risk-adjusted return analysis, it provides one more piece of the puzzle, helping us offer detailed explanations to our clients. The following is provided as an example only and is not intended to be a recommendation of any sort. PNC Large Cap Core Fund (MUTF: PLEAX ) posted a one-year return before expenses of 12.66%, while its benchmark-the S&P 500-returned 7.36%. According to attribution analysis, the fund had an allocation effect of 1.28% and a selection effect of 4.02%. While the PNC fund was slightly under-allocated to the information technology sector, providing an allocation effect of minus 0 bps, the portfolio manager’s stock selection within the sector was the primary factor of outperformance, providing a selection effect of 2.51%, with significantly higher weightings to Skyworks Solutions (NASDAQ: SWKS ) and NXP Semiconductors (NASDAQ: NXPI ) being big contributors for the period. Equally, a lower allocation to the underperforming energy sector during the year compared to the benchmark helped the fund mitigate losses to its portfolio, adding 75 bps to the allocation effect. Another, perhaps more recognizable, example is American Funds Investment Company of America (MUTF: AIVSX ) . The fund posts a one-year return of 4.71%, while its benchmark chalks up a 7.36% return. Attribution analysis shows the fund had a negative allocation effect of 1.03% and a negative selection effect of 1.62%. While the fund’s heavier weighting in Merck & Company (NYSE: MRK ) placed a 49-bp drag on the portfolio, it was under-allocated to the healthcare sector compared to its benchmark, tagging on an additional 94 bps of drag from that sector alone. In the passive versus actively managed portfolio debate there are times when one approach is better than the other. Knowing that time can be difficult, so steering clients to both actively and passively managed products can often be the right decision. Providing examples of when certain sectors are out of favor, when markets are flat, or when the manager is truly providing alpha can be shown using attribution analysis, which supports the inclusion of actively managed products. While passive proponents often give the nod to actively managed funds in the less efficient fund groups (emerging markets, small-caps, and municipals), as shown above attribution analysis and good research can help ferret out some hidden gems, even in well-covered, widely held classifications. Editor’s Note: This article discusses one or more securities that do not trade on a major U.S. exchange. Please be aware of the risks associated with these stocks.

U.S. Treasury Bond Funds Unscathed After China Cuts Stake

Many had the belief that the U.S. would be vulnerable to China’s quirks when the latter’s holdings of U.S. treasuries peaked to $1.65 trillion in 2014. China has chopped its holdings of U.S. treasuries by nearly $180 billion, but that sparked hardly any reaction from the treasury markets. Recent data from the Treasury Department showed benchmark 10-year yields dropped 0.6 percentage points despite the biggest foreign holder of U.S. debt chopping its holding between March 2014 and May 2015. China’s Holdings China has not reinvested the proceeds from maturing securities back into the treasuries; leading to a lower stake of nearly $180 billion from its peak. According to the latest Treasury data, China has $1.47 trillion of treasuries. This also includes $200 billion held through Belgium. Nomura has said that several Chinese custodial accounts are located in Belgium. Foreign buyers had played a key role in helping the treasury market boom to $12.7 trillion when the U.S. was trying to finance stimulus programs to come out of recession. China had been an active participant, reflected in the gigantic jump in holdings from less than $350 billion held previously. China is retreating as it looks to raise money to counter the dismal economic growth conditions and the recent market rout. Alternative Buyers Fill the Gap New regulations to avoid another financial collapse have made banks and such firms to buy highly-rated assets. Investors’ cash moved from bank deposits that have record low interest rates into mutual funds; which in turn have accumulated government debt. According to Fed data, stakes in treasuries and debt from federal agencies held by U.S. commercial banks have increased by nearly $300 billion since March 2014 to more than $2.1 trillion. Indirect bidders won 55% of the $1.2 trillion of notes and bonds that have been sold in 2015, up from 2014’s 43%. These indirect bidders include foreign investors and mutual funds. U.S. Treasury Mutual Funds to Buy China’s reduced holdings failed to have any negative impact on U.S. treasuries. It is evident that the alternatives stepped in; wherein many mutual funds too stockpiled substantial holdings. On that note, let’s look at mutual funds that have substantial U.S. treasuries holdings. The following funds carry a Zacks Mutual Fund Rank #1 (Strong Buy) or Zacks Mutual Fund Rank #2 (Buy). Remember, the goal of the Zacks Mutual Fund Rank is to guide investors to identify potential winners and losers. Unlike most of the fund-rating systems, the Zacks Mutual Fund Rank is not just focused on past performance, but the likely future success of the fund. These funds have strong 1-year returns. The 3-year and 5-year annualized returns are also encouraging. T. Rowe Price U.S. Treasury Long-Term (MUTF: PRULX ) invests a major portion of its assets in government affiliated U.S. treasury securities. The rest of the assets are invested in other government-backed instruments. It has a maturity between 15-20 years and may also vary from 10-30 years. PRULX carries a Zacks Mutual Fund Rank #1 and has returned 7.3% over the last 1 year. The 3- and 5-year annualized returns are 2.1% and 6%. The annual expense ratio of 0.51% is lower than the category average of 0.61%. Dreyfus U.S. Treasury Long-Term (MUTF: DRGBX ) seeks total return with capital growth and current income. DRGBX invests a majority of its assets in U.S. treasury instruments. DRGBX may also invest in other instruments which are approved by the domestic government or issued by its entities. DRGBX generally has a duration of more than or equal to 7.5 years and minimum of 10 years of weighted duration of maturity. DRGBX carries a Zacks Mutual Fund Rank #1 and has returned 7.3% over the last 1 year. The 3- and 5-year annualized returns are 2% and 6%. The annual expense ratio of 0.65% is however higher than the category average of 0.61%. Wasatch-Hoisington US Treasury (MUTF: WHOSX ) seeks return that beats inflation with an emphasis on both capital growth and current income. WHOSX invests a lion’s share of its assets in U.S. treasury securities and also in repurchase agreements backed by such securities. WHOSX carries a Zacks Mutual Fund Rank #2 and has returned 10.8% over the last 1 year. The 3- and 5-year annualized returns are 2.8% and 8%. The annual expense ratio of 0.70% is however higher than the category average of 0.61%. Fidelity Spartan Long-Term Treasury Bond Index Fund Fidelity Advantage (MUTF: FLBAX ) invests most of its assets in securities listed in Barclays U.S. Long Treasury Bond Index. The fund tries to replicate the performance of Barclays U.S. Long Treasury Bond Index by using statistical sampling techniques on the back of interest rate sensitivity and maturity among others. FLBAX carries a Zacks Mutual Fund Rank #2 and has returned 8.6% over the last 1 year. The 3- and 5-year annualized returns are 2.9% and 6.7%. The annual expense ratio of 0.1% is lower than the category average of 0.61%. Vanguard Long-Term Treasury Investor (MUTF: VUSTX ) invests a major portion of its assets in long-term bonds whose interest and principal payments are backed by the full faith and credit of the U.S. government. At least 65% of VUSTX’s assets will always be invested in U.S. treasury securities. VUSTX maintains a dollar-weighted average maturity of between 15 and 30 years. VUSTX carries a Zacks Mutual Fund Rank #2 and has returned 8.4% over the last 1 year. The 3- and 5-year annualized returns are 2.8% and 6.6%. The annual expense ratio of 0.2% is lower than the category average of 0.61%. Original Post