Tag Archives: mutual-fund

Sell The State, Buy The People

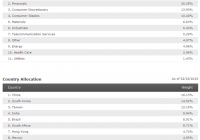
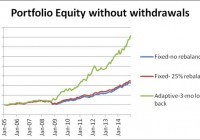
Summary State-owned companies dominate many emerging-market ETFs. State-owned companies generate lower return on assets than privately-managed firms. Avoiding the slower-growing state firms by going with small caps, or a fund such as XSOE. Investors can slice and dice the investment world into all manner of categories. One of the most common is to separate its investments into domestic and international, developed and emerging markets, then into regions or individual countries. A different way to slice the market is to break it down into state-owned and private companies. This is not a critical distinction for investors in the developed world, where deep capital markets offer exposure to many private firms, but many emerging markets are still developing their capital markets. A passive investment approach in emerging markets results in a state-owned heavy portfolio, but there are ways to avoid this exposure. State Interference Doesn’t Pay At least since Ludwig Von Mises published Economic Calculation in the Socialist Commonwealth , the case against socialist economic planning has been there for those who choose to look. Without information, an enterprise cannot make good decisions, and one of the first casualties of central planning is the informational content in prices. Prices exist in centrally-planned economies, but they do not reflect the supply and demand in the economy. The unfolding disaster in Venezuela, a country that suffered toilet paper shortages and is now occupying supermarkets with the army in its never-ending war against the laws of economics, is only the latest example of this basic truth. Clearly, one does not want to invest in a basket case such as Venezuela. At the other end, one cannot avoid some intervention in the economy, as nearly every nation on Earth has a central bank working to manipulate interest rates. In between are the mixed economies such as in China, where the transition to market capitalism is still incomplete. These countries have varying degrees of market forces, but one common trait in many is that state-owned enterprises (SOEs) compete alongside private firms. In many of those countries, the state-owned giants dominate the stock market and make up the bulk of market capitalization. The extreme case is China, where most of the listed companies on the mainland stock exchange are SOEs. In Brazil, semi-private Petrobras (NYSE: PBR ) has accounted for 20 percent of stock market capitalization alone. As oil prices have tumbled and PBR sees corruption charges swirl around the firm , investors in funds such as iShares MSCI Brazil (NYSEARCA: EWZ ) have paid the price. Investors who passively plunk money into market capitalization index funds are often unknowingly choosing to invest with the state and even where the firms are increasingly competitive, they still often lag behind fully-privatized competitors. Recent figures show that Chinese SOEs earn about 5 percent on assets , versus roughly 9 percent for private firms. SOEs in China achieve this low return despite access to cheap credit and regulatory favoritism, in part because the largest shareowner, the state, cares about many things besides profit. Additionally, the government officials in charge of these firms have their own private agendas, and those often stray into the realm of corruption. Some recent examples are the lackluster performance of Russian energy firms even when oil prices were high, Chinese banks that have run up a mountain of bad debt due to politically-motivated lending, and as mentioned above, Brazil’s largest company is racked with scandal. Aside from the aforementioned issues, there’s the issue of sector exposure. Many state-owned companies are banks, energy producers, utilities and telecom firms. While these companies can experience rapid growth in a rapidly-growing economy, they aren’t growing as fast as technology start-ups and new consumer companies catering to an emerging and increasingly wealthy middle class. Investment Options There are some ways around this, the easiest of which is to go with small caps, though that involves taking on more volatility. Broad small-cap ETFs, such as WisdomTree Emerging Markets SmallCap Dividend (NYSEARCA: DGS ), reduce exposure to SOEs. Guggenheim China Small Cap (NYSEARCA: HAO ) and Market Vectors Brazil Small Cap (NYSEARCA: BRF ) both offer a different mix of sector exposure along with avoiding the giant SOEs that populate many emerging-market ETFs. Some sector ETFs, such as KraneShares CSI China Internet (NASDAQ: KWEB ) achieve the same result. WisdomTree Emerging Markets ex-State-Owned Enterprises (NYSEARCA: XSOE ) WisdomTree launched XOSE in December to help investors maintain emerging market exposure while avoiding state-owned companies. The case for the fund is straightforward: the growth of emerging markets is the story of a rising middle class. The sectors most poised to benefit are those that serve these customers: consumer staples, consumer discretionary and healthcare firms. Technology is also an emerging sector in many of these countries that is growing far faster than the overall economy. To really profit from the growth of emerging markets, investors want to be positioned in the sectors pulling GDP forward, not the moribund state-owned enterprises that lag behind or at best, are indirect plays on the commodity cycle. From WisdomTree’s website : (click to enlarge) Technology is the largest sector exposure at nearly 23 percent of assets. Healthcare is underweight, consumer discretionary and consumer staples are the third and fourth largest sectors. Financials are a large portion of assets at about 20 percent, but that is less than many emerging market funds. One reason why the fund isn’t better positioned with respect to sectors is because the fund’s main goal is the removal of SOEs, not a shift in sector exposure. From WisdomTree, the index criteria (emphasis mine): ” State owned enterprises are defined as government ownership of more than 20% of outstanding shares of companies. The index employs a modified float-adjusted market capitalization weighting process to target the weights of countries in the universe prior to the removal of state owned enterprises while also limiting sector deviations to 3% of the starting universe. ” For investors who want to remove SOE exposure while still getting similar sector and country exposure as the run-of-the-mill emerging-market fund, XSOE is a great choice. Assuming the state-owned companies aren’t reformed and unlock hidden value from their assets, over time XSOE should beat the market capitalization weighted competition such as iShares MSCI Emerging Markets (NYSEARCA: EEM ). The case for owning XSOE over other funds is stronger today because the sectors dominated by SOEs are at the center of the slowdown in emerging markets, from China’s debt-laded banks to Brazil and Russia’s energy-heavy stock markets. The fund might lag for long periods when plain vanilla emerging market funds benefit from the sector exposure that SOEs bring, but over the long run, XSOE is likely to come out ahead thanks to holding shares in more efficient firms. Disclosure: The author has no positions in any stocks mentioned, and no plans to initiate any positions within the next 72 hours. (More…) The author wrote this article themselves, and it expresses their own opinions. The author is not receiving compensation for it (other than from Seeking Alpha). The author has no business relationship with any company whose stock is mentioned in this article.

Investing For Retirement Using T. Rowe Price Mutual Funds

Summary T. Rowe Price offers a set of high-performing mutual funds which can be successfully used for construction of investment portfolios with good withdrawal rates. From January 2005 to December 2014, a T. Rowe Price portfolio with fixed allocation could produce a safe 5% annual withdrawal rate and 7.84% annual increase of the capital. Same portfolio with rebalancing at 25% deviation from the target allowed a safe 5% annual withdrawal rate and achieved 8.48% compound annual increase of the capital. Better performance could be achieved using adaptive asset allocation. Same portfolio could have produced a safe 15% annual withdrawal rate and 6.58% annual increase of the capital. The drawdowns of the portfolios are relatively small considering their high returns. This article belongs to a series of articles dedicated for investing in various mutual fund families. In previous articles, we reported our research on Fidelity and Vanguard mutual fund families. The current article does the same for T. Rowe Price family of mutual funds. Four mutual funds have been selected for investment. They are the following: T. Rowe Price U.S. Treasury Long-Term Bond Fund (MUTF: PRULX ) T. Rowe Price Health Sciences Fund (MUTF: PRHSX ) T. Rowe Price Media And Telecommunications Fund (MUTF: PRMTX ) T. Rowe Price Global Technology Fund (MUTF: PRGTX ) In this article, three different strategies will be considered: (1) Fixed asset allocation: The portfolio is initially invested 40% in the bond fund and 60% equally divided between the stock funds, without rebalancing. (2) Target asset allocation with rebalancing: The portfolio is initially invested 40% in the bond fund and 60% equally divided between the stock funds and is rebalanced when the allocation to any fund deviates by 25% from its target. (3) Momentum-based adaptive asset allocation: The portfolio is at all times invested 100% in only one fund. The switching, if necessary, is done monthly at closing of the last trading day of the month. All money is invested in the fund with the highest return over the previous 3 months. The data for the study were downloaded from Yahoo Finance on the Historical Prices menu for four tickers: PRULX, PRHSX, PRMTX, and PRGTX. We use the monthly price data from January 2005 to December 2014, adjusted for dividend payments. The paper is made up of two parts. In part I, we examine the performance of portfolios without any income withdrawal. In part II, we examine the performance of portfolios when income is extracted periodically from the accounts. Part I: Portfolios without withdrawals In Table 1, we show the results of the portfolios managed for 10 years, from January 2005 to December 2014. Table 1. Portfolios without withdrawals 2005-2014 Strategy Total increase% CAGR% Number trades MaxDD% Fixed-no rebalance 228.89 12.64 0 -28.82 Target-25% rebalance 247.01 13.25 4 -24.54 Adaptive 714.50 23.33 52 -11.57 The time evolution of the equity in the portfolios is shown in Figure 1. (click to enlarge) Figure 1. Equities of portfolios without withdrawals Source: This chart is based on Excel calculations using the adjusted monthly closing share prices of securities From Figure 1, it is apparent that the rate of increase of the adaptive portfolio is substantially greater than the rate of the fixed and target allocation portfolios. Part II: Portfolios with withdrawals Assume that we invest $1,000,000 for income in retirement. We plan to withdraw monthly a fixed percentage of the initial investment. That amount is increased by 2% annually in order to account for inflation. In Table 2, we show the results of the portfolios managed for 10 years, from January 2005 to December 2014. Money was withdrawn monthly at a 5% annual rate of the initial investment, plus a 2% inflation adjustment. Over the 10 years from January 2005 to December 2014, a total of $535,920 was withdrawn. Table 2. Portfolios with 5% annual withdrawal rate 2005-2014 Strategy Total increase% CAGR% Number trades MaxDD% Fixed-no rebalance 128.08 7.84 0 -30.71 Target-25% rebalance 127.68 8.48 4 -29.65 Adaptive 297.64 19.74 52 -14.08 The time evolution of the equity in the portfolios is shown in Figure 2. (click to enlarge) Figure 2. Equities of portfolios with 5% annual withdrawal rates Source: This chart is based on Excel calculations using the adjusted monthly closing share prices of securities To illustrate the effect of the withdrawal rates on the evolution of the capital, we report simulation results for two strategies: fixed target with rebalancing and momentum-based adaptive asset allocation. In Table 3, we report the results of simulations of the fixed target portfolio with the following withdrawal rates: 0%, 5%, 6%, 8%, and 10%. Table 3. Fixed Target Portfolios with rebalancing at 25% deviations for various annual withdrawal rates 2005-2014 Withdrawal rate % Total increase% CAGR% MaxDD% 0 247.00 13.25 -24.54 5 125.77 8.48 -29.65 6 95.96 6.96 -31.23 8 51.06 4.21 -34.16 10 1.32 0.13 -37.14 The time evolution of the equity in the portfolios is shown in Figure 3. (click to enlarge) Figure 3. Equities of fixed target portfolios with rebalancing at 25% deviation from targets and 5% annual withdrawal rates Source: This chart is based on Excel calculations using the adjusted monthly closing share prices of securities To illustrate the advantage of the adaptive allocation strategy and the effect of withdrawal rates on the evolution of the capital, we give in Table 4 the results of simulations for the following withdrawal rates: 0%, 5%, 10%, and 15%. Table 4. Adaptive Portfolios with various annual withdrawal rates 2005-2014 Withdrawal rate % Total increase% CAGR% MaxDD% 0 714.50 23.33 -11.57 5 506.07 19.74 -14.08 10 297.64 14.80 -19.05 15 89.21 6.58 -30.72 The time evolution of the equity in the portfolios is shown in Figure 4. (click to enlarge) Figure 4. Equities of momentum-based portfolios with various annual withdrawal rates Source: This chart is based on Excel calculations using the adjusted monthly closing share prices of securities Conclusion The set of four mutual funds, selected for this study, perform exceptionally well for all three strategies and generate high returns at relatively low drawdowns. Between 2005 and 2015, the fixed target allocation with rebalancing was able to sustain withdrawal rates of up to 10% annually. The adaptive allocation algorithm was able to sustain withdrawal rates up to 15% annually without any decrease of capital. Disclosure: The author has no positions in any stocks mentioned, and no plans to initiate any positions within the next 72 hours. (More…) The author wrote this article themselves, and it expresses their own opinions. The author is not receiving compensation for it (other than from Seeking Alpha). The author has no business relationship with any company whose stock is mentioned in this article. Additional disclosure: This article is the third in a sequence on investing in mutual funds for retirement accounts. To help the reader compare the past performance of various mutual fund families, I selected a benchmark 10-year time interval starting on 1 January 2005 and ending on 31 December 2014. The article was written for educational purposes and should not be considered as specific investment advice.

Can Quarterly Asset Allocations Predict Future Stock Performance? If So, What Action Should Many Investors Take Now?

Summary Most investors try to formulate appropriate allocations to stocks vs. bonds and cash. But do these allocations predict future returns? And if so, how far ahead? Ten years of quarterly allocation data were analyzed. High allocations to stocks were associated with significantly higher returns over the following three years and vice versa. Since research based allocation judgments currently suggest lower stock allocations, to avoid low returns, investors may want to have a lower than normal allocation now. Most investors try to formulate appropriate allocations to stocks vs. bonds and cash, even if the latter are close to zero. Some try to keep that allocation fixed, such as for example, 60%/40%, stocks to bonds. Others, however, might regularly alter the mix depending on a variety of factors, such as for example, rising vs. falling interest rates, strength of economic growth, etc. The question to be addressed in this article is, assuming the use of a changing quarterly asset allocation, coupled with a relatively long-term approach to determining these allocations, is it possible to enhance a portfolio’s returns by assuming that relatively high allocations to stocks suggest better returns several years down the road? Of course, high allocations should mean an expectation of better stock market returns ahead, and vice versa, otherwise, why would you invest a high percentage in stocks at all. But I would assume that most investors who make changes to their allocations as frequently as once every quarter or so, would not really expect these changes to be predictive of overall stock returns for periods as great as three years. So if they were predictive, investors could have some degree of confidence that their long-term future portfolio performance would likely be more successful when current allocations were high, and vice versa. For many years now (actually going back to 2000), I have been making such quarterly allocations as part of a set of Model Portfolios that I publish on my website . One of my main interests, then, has been addressing if these changing allocations prove to correspond to reality. More specifically, suppose I tell my readers who have a moderate risk profile that 65% of their investments should be in stocks and say 30% in bonds, and 5% in cash, will those who follow that suggestion be rewarded with higher subsequent returns than those who chose to invest only 50% in stocks? Of course, choosing a relatively low allocation to stocks may not just be about achieving the highest returns. One might stick with a lower allocation in order to reduce their level of risk. But assuming that most “moderate risk” level investors truly want to achieve the highest level of returns while keeping their risk level moderate, a recommendation for a higher level of stock allocation should be interpreted as a favorable sign that assumes the same level of risk as before the recommendation. As is typical, the stock market has exhibited highly variable returns over the last decade with many events occurring that could have potentially influenced relatively short-term results. But if one is a long-term investor, one can see that it should pay to try to overlook events that might only influence one’s returns relatively briefly and focus instead on possible long-term influences. With this in mind, let’s look at my quarterly allocations to stocks beginning in Jan. 2005 and compare them to subsequent three year annualized returns for the S&P 500 index. To better visualize the effect of a high vs. a lower level of allocation to stocks, we present the results in two tables. The first table shows all quarters going back to 1-05 in which we, on the date shown, recommended a relatively high allocation to stocks. This was arbitrarily defined as 55% or higher for Moderate Risk Investors. The second table shows all quarters since 2005 in which we, on the date shown, recommended a relatively low allocation to stocks, which we defined as 52.5% or below. Here are the results, followed by further analysis. Note that since we chose 3 years after an allocation was made to analyze results, the latest quarter to be included was 1-12; for 4-12 and beyond, 3 years has not elapsed yet. Table 1: Annualized Returns for the S&P 500 Index 3 Yrs. After “High” Stock Allocation Recommendations Quarter Beginning Allocation to Stocks Annualized Return Quarter Beginning Allocation to Stocks Annualized Return 1-12 62.5% 20.4% 4-10 60 12.7 10-11 60 23.0 1-10 57.5 10.9 7-11 62.5 16.6 10-07 55 -7.2 4-11 65 14.7 7-07 55 -9.8 1-11 65 16.2 4-05 55 5.8 10-10 62.5 16.3 1-05 55 8.6 7-10 60 18.5 Note: The average yearly return for these high allocation recommendations was 11.3% As can be seen, three years after relatively high allocation recommendations were made, most of the annualized returns on the S&P 500 index turned out to be excellent, ranging from over 20% to a little less than 9% per year. These recommended allocations, therefore, were highly successful in suggesting good future performance. In numerical terms. the success rate of the high allocation recommendations in Table 1 was 77% . or 10 out of 13 comparisons. Table 2: Annualized Returns for the S&P 500 Index 3 Yrs. After “Low” Stock Allocation Recommendations Quarter Beginning Allocation to Stocks Annualized Return Quarter Beginning Allocation to Stocks Annualized Return 10-09 50 13.2 4-07 52.5 -4.2 7-09 50 16.5 1-07 52.5 -5.6 4-09 45 23.4 10-06 52.5 -5.4 1-09 37.5 14.2 7-06 50 -8.2 10-08 42.5 1.2 4-06 52.5 -13.0 7-08 45 3.3 1-06 52.5 -8.4 4-08 47.5 2.4 10-05 52.5 0.2 1-08 52.5 -2.9 7-05 52.5 4.4 Note: The average yearly return for these low allocation recommendations was 1.9% In this table, you can see that three years after relatively low allocation recommendations were made, the majority of the annualized returns on the S&P 500 index turned out to be poor, ranging from -13% to a meager +3.3% per year. In some quarters, a low stock allocation did not produce a low three year annualized return. In fact, these quarters subsequent performance showed just the opposite, a high 3 year annualized return. In numerical terms, the success rate of the low allocation recommendations in Table 2 was 75% , or 12 out of 16 comparisons. When I applied the same kind of analysis on my high vs. low allocation to bonds, I got the same kind of results favoring the high allocations to the lower ones by a significant amount. (These results are reported at this link .) Further Analysis of These Results These observations will help to put this data in perspective: -We recommended relatively high allocations to stocks early in 2005, in the latter half of 2007, and in the years following the end of the 2007-2009 bear market. Of course, as we began raising our allocations considerably beginning in 2010, no one could know that a continued multi-year bull market lay ahead. But the factors that we regarded as important suggested higher allocations would enhance returns. -We recommended relatively low allocations to stocks in the years leading up to the 2007 bear market and for its duration. As above, no one knew in those years that a bear market was coming and when it came, when it would end. -The average degree of difference between the subsequent returns of our higher and lower allocation quarters was substantial – nearly a 9.5% better annualized return in favor of the former (11.3 vs. 1.9%). -However, we tended to make the wrong allocation judgment ahead of “turning points”: When the market was about to go from bull to bear (2007), we were too positive; when it was about to go back into bull mode (early 2009) and a little beyond, we were too negative. -Absolute percent level of allocation to stocks was not the key; what was key was a relatively high allocation vs. a relatively low allocation, as defined above. In other words, when we had a strong sense that stocks would do well, as compared to at other times, they usually did; when we had a weak sense that stocks would do well, as compared to at other times, they usually didn’t. What This Data Suggests for Future Returns Of course, in investing, past data can never ensure or guarantee that future results will be similar. But what I have demonstrated above is that you should not assume that pre-selecting a fixed asset allocation that seems appropriate for your risk tolerance and keeping your allocations at or near this allocation is a rock solid, guiding principle for managing your investments. Yet such a prescription typically appears to form the basis of how very many investors indeed manage their investments from year to year. A cursory look at the above tables shows the obvious – that investment returns, particularly for stocks, vary greatly from quarter to quarter and from year to year. Most of us have been told, though, by investment experts that it is extremely hard, if not impossible, to accurately forecast in advance what these changes will be. But the above tables seem to demonstrate that even two or three years in advance, it is possible to use well-chosen information to get a good sense of what kinds of returns, generally at or above par, or below par, might be expected from stocks and bonds. The problem most people run into, at least in my opinion, is that they mainly focus on trying to predict how stocks or bonds will do for much shorter periods. It is mainly such predictions that have a much reduced chance of success. Unfortunately, as you might have anticipated, I can’t provide an all-in-one formula for attempting to make accurate predictions for two or three years down the road. But let me just reiterate that it is possible to successfully make such predictions, especially if one gives up on a) looking too much at short-term events that likely won’t matter much in a year or two and focusing instead of matters that likely will matter; and b) expecting the predictions to always be right; if you are unwilling to proceed without near 100% certainly, you will miss out on many likely outcomes that will happen the majority of the time, but not 100% of the time. In our most recent Model Portfolios, I have dropped back our allocations to both stocks and bonds, but especially stocks, from where they were several years ago. Take a look at the most recent allocations for moderate risk investors: Recent Overall Quarterly Asset Allocations for Stocks and Bonds Quarter Beginning Allocation to Stocks Allocation to Bonds Quarter Beginning Allocation to Stocks Allocation to Bonds 4-12 67.5 25 10-13 55 25 7-12 67.5 27.5 1-14 52.5 25 10-12 67.5 27.5 4-14 50 27.5 1-13 67.5 27.5 7-14 50 25 4-13 67.5 27.5 10-14 50 25 7-13 65 25 1-15 50 25 These stock allocations suggest that if the predictive patterns of our earlier allocations hold true, upcoming 3 year returns for stocks may soon start to fall back considerably for periods beginning 1-14. And if the results turn out matching pretty closely those reported in Table 2, it is possible that within the next few years, stock returns between 2014 and 2017 may wind up averaging in the low single digits when annualized over three years. This means that since 2014 was a pretty good year for stocks, especially the S&P 500, either 2015 and 2016 or both, will likely show considerably smaller, or even a year (or possibly two) of negative, returns. Two year average returns for bonds have already dropped off considerably since early 2011, and our recent below average allocations suggest that the same will likely continue for the next few years. How should moderate risk investors position their investment portfolios over the next several years? In light of the above findings, it is suggested that investors who want to avoid potentially subpar returns from the main stock benchmarks, mirrored by investments such as Vanguard 500 Index ETF (NYSEARCA: VOO ), should consider deviating away from the relatively high allocations that have been successful since the start of the 2009 stock bull market. Such returns, according to data suggested by this research, could be coming for stocks for at least the next several years. Disclosure: The author has no positions in any stocks mentioned, and no plans to initiate any positions within the next 72 hours. (More…) The author wrote this article themselves, and it expresses their own opinions. The author is not receiving compensation for it. The author has no business relationship with any company whose stock is mentioned in this article.