Tag Archives: most-popular

3 Reasons Why Risk Is Exiting The Debate Stage

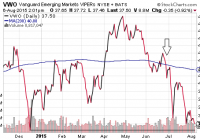
Investors tend to ignore financial markets until they really start to move significantly in one direction or the other. Ironically, investors who wait to buy undervalued securities when the technical backdrop is dramatically improving tend to miss out on sensible risk-taking opportunities. Don’t let the flatness fool you; risk-taking is subsiding and risk-aversion is gaining. More than a handful of people asked me if I would be watching the big debate. 10 candidates. One stage. Which politician will emerge as the clear-cut favorite to win the Republican party nomination? It may surprise some folks, but I have zero interest in the made-for-television event. Each individual will receive about as much air time as Bethe Correia earned in her UFC Title fight against Ronda Rousey. (America’s superstar dropped the Brazilian fighter in 34 seconds.) From my vantage point, a debate exists when two individuals (or two unique groups) express vastly different opinions. And I would be intrigued by an actual match-up with actual position distinctions. Scores of presidential hopefuls from one side of the aisle looking to land a sound byte? I’d rather watch multiple reruns of ESPN’s SportsCenter. In other words, I will tune in when it’s Walker v. Kasich and Hillary versus Joe. (I am name-dropping, not predicting.) In the same way that I might ignore political theater until it really starts to matter, investors tend to ignore financial markets until they really start to matter. And by really start to matter, I mean move significantly in one direction or the other. Ironically, investors who wait to buy undervalued securities when the technical backdrop is dramatically improving tend to miss out on sensible risk-taking opportunities. In the same vein, those who wait to reduce exposure to extremely overvalued stocks when the technical backdrop is weakening tend to miss out on sensible risk-reduction opportunities. What’s more, theoretical buy-n-holders shift to panicky sellers when the emotional pain of severe losses overwhelm them. Although the Dow is slightly negative in 2015, and the S&P 500 is slightly positive, risk has already been sneaking out the back door. Don’t let the flatness fool you; don’t be misled by ‘journalists’ with political agendas. Risk-taking is subsiding and risk-aversion is gaining. Here are three reasons why risk has been exiting the debate stage: 1. The Recovery Is Stalling . Bad news on the economy had been good news throughout the six-and-a-half year stock bull. The reason? The Fed maintained emergency level policies of quantitative easing (i.e., QE1, QE2, Operation Twist, QE3) as well as zero percent overnight lending rates. Today, however, the Fed desperately wants to flip the narrative such that committee members can claim the economy is healthy enough for rate tightening. The data suggest otherwise. For example, Wednesday’s ADP report of 185,000 jobs in July was 20% lower than July of 2014 a year earlier. It is also the lowest headline ADP number since Q1 2014 when an unusually rough winter shouldered the blame. This goes along with the worst wage growth since data have been kept (0.2%), U-6 unemployment between 10.8% ( BLS ) and 14.6% (Gallup), as well as the lowest percentage of employees participating in the working-aged labor pool (62.7%) since 1977. It gets worse. Factory orders have only experienced month-over-month growth in 3 of the last 12 months. Year-over-year, export activity is down 6.6%. Business spending via capital expenditures – dollars used to acquire or upgrade plants, equipment, property and other physical assets – has plummeted. Corporate revenue (sales) will be negative for the second consecutive quarter, perhaps contracting -3.8% in Q2 per FactSet. What’s more, the Conference Board’s Consumer Confidence sub-indexes are dismal; the future expectations gauge is falling at a faster month-over-month clip than the present situation measure. Consumer spending is sinking as well. In sum, risk aversion as well as outright bearish downturns are frequently associated with recessionary pressures. Is a recession imminent? Maybe not. Yet risk-off movement in the financial markets reflect understandable concerns that the U.S. economy may not be capable of absorbing multiple rounds of Federal Reserve tightening. 2. Commodities Are Tanking . One could easily wrap the commodities picture up into discussions about the U.S. economy. That said, I am pulling the topic out into a separate header because it reflects economic woes around the world. As it stands, the IMF’s most recent projections for global output in 2015 represent the slowest annual ‘expansion’ in four years. And the waning use of raw materials is a big part of the IMF’s anemic outlook as well as the collapse in commodity prices. For a year now, a wide variety of analysts have endeavored to explain the oil price decline in positive terms. They’ve been wrong. Consumers and businesses are not spending their energy savings. Meanwhile, energy companies are abandoning projects, laying off high-paying employees and witnessing a dramatic exodus from their stock shares. The Energy Select Sector SPDR ETF (NYSEARCA: XLE ) has depreciated by more than 30% already. Similarly, many of the world’s emerging markets (and some developed markets) depend upon the extraction of materials and natural resources. Granted, the U.S. stock market has been an island unto itself since 2011. However, no market is an island unto itself indefinitely. The Vanguard FTSE Emerging Markets ETF (NYSEARCA: VWO ) is reaching for 52-week lows. The PowerShares DB Commodity Index Tracking ETF (NYSEARCA: DBC ) is already there. And in the last two U.S. recessions, year-over-year commodity depreciation via the Core CRB Commodity Index led forward S&P earnings estimates significantly lower. 3. ‘Technicals’ Are Faltering . Overvalued equities can become even more overvalued, particularly when authorities are easing the rate reins and/or an economy is expanding at a brisk pace. In fact, expensive stocks often become even pricier before market participants typically become squeamish. Yet current technical data show that – across the entire risk spectrum – the smarter money may be seeking safer pastures. What’s more, authorities are talking about tightening at a time when the economy is not expanding briskly. In the bond market, the spread between the Composite Corporate Bond Rate (CCBR) and the 10-year yield is widening. That is a sign of risk aversion. Similarly, investment grade treasuries are witnessing higher highs and higher lows (bullish) whereas the iShares iBoxx $ High Yield Corporate Bond ETF (NYSEARCA: HYG ) has seen lower highs and lower lows (bearish). These developments are also signs of risk leaving the room before the elephant. In equities, more stocks in the S&P 500 are below their long-term moving average (200-day) than above them. This is coming form a place where 85% of the components had been in technical uptrends. Historically speaking, this kind of narrowing in market breadth is typically associated with an eventual stock benchmark correction. Additionally, as I had identified in my commentary one week ago , the New York Stock Exchange Advance Decline Line (A/D) has a strong track record as a leading indicator of corrections/bears. It recently crossed below its 200-day for the first time in four years (as it did prior to the euro-zone crisis in 2011). In addition, decliners have been pressuring and outpacing advancers regularly since the beginning of May. Granted, the Dow Jones Industrials (DJI) Average and the Dow Jones Transportations (DJT) Average may not be as important as the S&P 500 in identifying technical breakdowns. (Dow Theorists would disagree with me on that.) Nevertheless, when the DJI and DJT are both signalling the potential for longer-term downtrends, there’s something going on. What’s going on? Risk is quietly tip-toeing off the stage. I’ve been telling folks for several months to rethink partying like it’s 1999 . Otherwise, you may find that you overstayed your welcome and that the punch bowl is empty. Is it too late to ratchet down the risk? Hardly. When sky-high valuations meet with weakness in market internals, a 65% growth/35% income investor might make a strategic shift toward 50% large-cap and mid-cap equity/30% investment-grade income/20% cash. You’ve reduced equity risk by avoiding small companies; you’ve reduced income risk by exiting higher-yielding junk. And you’ve given yourself the cash that put you in the right frame of mind to be able to “buy lower” in the next correction. Disclosure: Gary Gordon, MS, CFP is the president of Pacific Park Financial, Inc., a Registered Investment Adviser with the SEC. Gary Gordon, Pacific Park Financial, Inc, and/or its clients may hold positions in the ETFs, mutual funds, and/or any investment asset mentioned above. The commentary does not constitute individualized investment advice. The opinions offered herein are not personalized recommendations to buy, sell or hold securities. At times, issuers of exchange-traded products compensate Pacific Park Financial, Inc. or its subsidiaries for advertising at the ETF Expert web site. ETF Expert content is created independently of any advertising relationships.
How To Catch A Falling Knife

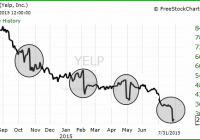
Summary The “falling knife” stock is increasingly common. The current economic environment increases risk in falling stocks. One long-established investment technique can minimize the risk. Falling knife: A security or industry in which the current price or value has dropped significantly in a short period of time. A falling knife security can rebound, or it can lose all of its value, such as in the case of company bankruptcy where equity shares become worthless. –Investopedia Remember Boston Chicken? Inspired by the heady days of the late ’90s and my personal effort to improve their top line, I watched BOST decline in price and finally made a major share purchase when it was so low I could not resist. To this day I maintain that no company can go broke trying to sell too much fat, salt, and sugar to the American public. This axiom was overcome by BOST’s incestuous finances and the practice of selling one dollar of chicken for 95 cents, which led to bankruptcy in 1998. A $50 check from the subsequent class action lawsuit did little to assuage my five figure loss. There were many lessons to be had from this experience. The one I want to concentrate on is the value of dollar cost averaging, or DCA, in purchasing stocks that are declining in price. DCA refers to planned purchases in multiple increments over time, in contrast to a one time purchase of the full investment. If I had used DCA with Boston Chicken, my loss would have been much less severe. DCA is useful in many circumstances, but its benefits are magnified in cases where a stock is in a significant decline. The Falling Knife Scenario The classic falling knife scenario consists of an abrupt price change. Yelp is a particularly hair-raising example: A broader definition of “falling knife” is any stock that is in a clear price decline over a period of time. Under this definition there are many falling knives among today’s investment choices. Every day articles appear on Seeking Alpha enthusiastically recommending a purchase because stock X is N per cent off its high. Readers will often note that such articles have appeared since a decline began. Here are three companies in the falling knife category that have had bullish articles all the way down: American Capital Agency (NASDAQ: AGNC ), Emerson Electric (NYSE: EMR ), Chevron (NYSE: CVX ): How long and how severe these declines will be no one knows. At losses from 52 week highs of 22%, 19%, and 30% for EMR, AGNC and CVX there could still be a lot of air underneath them. Other widely held falling knives include: Exxon Mobil (NYSE: XOM ). Intel (NASDAQ: INTC ), Caterpillar (NYSE: CAT ), Freeport-McMoRan (NYSE: FCX ), BHP Billiton (NYSE: BBL ) (NYSE: BHP ), National Oilwell Varco (NYSE: NOV ), and 3M (NYSE: MMM ). The DCA Effect Using Chevron as an example the usefulness of DCA is clear. An investment of $30,000 when CVX had declined 10% from its high of $130 would buy 256 shares: Date Price Investment Shares 10/02/2015 $117 $30,000 256 Value 08/01/15 $88 $22,528 256 An investment in three increments over equal time periods would buy 293 shares: Date Price Investment Shares 10/02/2015 $117 $10,000 85 03/01/2015 $105 $10,000 95 08/01/20015 $88 $10,000 113 Value 08/01/15 $88 $25,784 293 The DCA approach buys 37 more shares, $3,256 more in value, and $159 more in annual income. If CVX returns to $130, the price at which it started, the difference in total value rises to $4,810. It is true that there is a possibility of losing out on some gains if a stock rises in value between purchases. But as Daniel Kahneman wrote in classic book Thinking, Fast and Slow : Losses loom larger than gains. The “loss aversion ratio” has been estimated in several experiments and is usually in the range of 1.5 to 2.5. For the average investor, the good feelings you get from gains are more than wiped out by the bad feelings from losses. Perhaps humans have an instinctual aversion to loss of capital. Why is DCA important now? DCA has strengths that apply to all circumstances, such as reducing risk and replacing emotion with discipline. In today’s markets its benefits are particularly important. After six years of almost uninterrupted rise in stock prices, recency bias is very strong. Recency bias causes investors to believe trends and patterns have observed in the recent past will continue in the future. Investors look at where a stock has been, not where it is going. Complacency among investors is high. New investors have with no experience of a declining market have an inflated sense of their stock-picking ability. Older investors, with six years of mostly positive experience, may think that their prowess has improved more than it has. Price declines reflect changes in the macroeconomic situation. Global growth estimates continue to be lowered. Money is no longer being added to the US system through quantitative easing, and as shown by Eric Parnell and others there has been a strong relationship between QE and stock market performance. In addition, numerous indicators have been flashing warning signs for some time. DCA is agnostic concerning market projections but economic changes do affect results. Conclusions The falling knife conundrum — what to do when a stock we like is falling — is increasingly common. The angel on one shoulder tells us to buy and the angel on the other shoulder tells us not to lose money. Dollar cost averaging is a way to resolve these different impulses. DCA is helpful in many situations, but particularly today when uncertainty is increasing and six years of successful stock-picking may have inflated both our confidence in the market and the perception of our abilities. DCA takes away the pressure of having to make a one-time purchase decision, allows us to act independently of market noise, and reduces risk. Disclosure: I/we have no positions in any stocks mentioned, but may initiate a long position in XOM EMR over the next 72 hours. (More…) I wrote this article myself, and it expresses my own opinions. I am not receiving compensation for it (other than from Seeking Alpha). I have no business relationship with any company whose stock is mentioned in this article.

Lipper Closed-End Fund Summary: July 2015

By Tom Roseen While for the third consecutive month equity CEFs suffered negative NAV-based returns (-0.72% on average for July) and market-based returns (-1.96%), for the first month in three fixed income CEFs were able to claw their way into positive territory, returning 0.45% on a NAV basis and 0.82% on a market basis While the NASDAQ Composite managed to break into record territory in mid-July after a strong tech rally following Google’s surprising second quarter result, as in June advances to new highs were generally just at the margin. Despite signs of improvement in Greece’s debt crisis and on China’s stock market meltdown, investors turned their attention to second quarter earnings reports and began to evaluate the possible impacts slowing growth from China and the global economy will have on market valuations. The markets remained fairly volatile during July. At the beginning of the month rate-hike worries declined slightly after an inline jobs report and soft wage growth were thought to give policy makers an excuse to postpone rate hikes until December. The Labor Department reported that the U.S. economy had added 233,000 jobs for June. And while the unemployment rate declined to 5.3%, most of it was due to people leaving the labor force. With the Chinese market taking back some of its losses and the Greek debt saga appearing to be closer to a resolution, European stocks rallied mid-month. However, later in the month disappointing earnings results from the likes of Apple (NASDAQ: AAPL ), Caterpillar (NYSE: CAT ), and Exxon (NYSE: XOM ) and commodities’ continuing their freefall placed a pall over the markets. Concerns over slowing global growth and the Shanghai Composite’s recent meltdown weighed on emerging markets, sending Lipper’s world equity CEFs macro-group (-1.52%) to the bottom of the equity CEFs universe for the month. While plummeting commodity prices weren’t much kinder to domestic equity funds (-0.80%), investors’ search for yield helped catapult mixed-asset CEFs (+0.77%) to the top of the charts for July. With China suffering its worst monthly market decline in six years, crude oil prices closing at a four-month low, and gold futures posting their worst monthly performance in two years, investors experienced bouts of panic and sought safe-haven plays intermittently throughout the month. At maturities greater than two years Treasury yields declined, with the ten-year yield declining 15 bps to 2.20% by month-end. For the first month in four all of Lipper’s municipal bond CEFs classifications (+1.10%) witnessed plus-side returns for July. However, domestic taxable bond CEFs (-0.13%) and world bond CEFs (-0.98%) were pulled down by investors’ risk-off mentality. For July the median discount of all CEFs narrowed 2 bps to 10.50%-worse than the 12-month moving average discount (9.13%). Equity CEFs’ median discount widened 41 bps to 11.15%, while fixed income CEFs’ median discount narrowed 58 bps to 9.86%. For the month 46% of all funds’ discounts or premiums improved, while 51% worsened. To read the complete Month in Closed-End Funds: July 2015 Fund Market Insight Report, which includes the month’s closed-end fund corporate events, please click here .