Tag Archives: most-popular

Momentum And Stop Losses

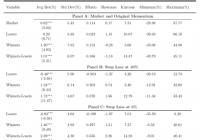
Stop losses are a form of trend following in which you switch from risky assets, such as stocks, to a risk-free or fixed income asset after there are pre-determined cumulative losses. The random walk hypothesis (RWH) was widely accepted in the 1960s and 1970s. It was synonymous with market efficiency. It effectively eliminated any academic interest in stop loss rules. Under RWH, with stock returns being independent, stop losses would decrease a strategy’s expected return. There remains a cultural affinity to RWH despite strong contrary evidence now. This may explain why there is still considerable indifference to stop loss policies and trend following in general among institutional investors, who were schooled in old academic ideas. In their paper, ” When Do Stop-Loss Rules Stop Losses? “, Kaminski and Lo (2013) show both theoretically and empirically that if stock returns have positive serial correlation (there is overwhelming evidence that they do), then stops can add value. Over monthly intervals of daily stock futures data from 1993 through 2011, the authors found that volatility-based stop loss rules could increase monthly returns 1.5% while substantially decreasing volatility. When stopped out of stocks, long-term bond futures are used as a safe harbor asset. In ” Taming Momentum Crashes: A Simple Stop-Loss Strategy “, Han, Zhou, and Zhu (2014) showed the effectiveness of a stop loss overlay applied to a momentum-based strategy. The authors examined the top decile of U.S. stocks from 1926 through 2011 based on relative strength momentum over the preceding 6 months (the authors showed similar results using 12-month momentum). They sold any stock if it dropped 10% below the beginning price of the month. They followed the same procedure for short positions. Portfolios were rebalanced monthly. This stop loss strategy raised the average monthly return from 1.01% to 1.73% (buy and hold was 0.62%) and reduced the monthly standard deviation from 6.07% to 4.67%. [1] Momentum crash risk (from short positions) was completely eliminated. The worst monthly return for buy and hold was -28.98%, while the worst monthly return for an equally weighted momentum strategy was -49.79%, showing the increased risk of applying momentum to individual stocks. The stop loss overlay improved the worst monthly return to only -11.34%. For value weighted portfolios, the maximum monthly loss for momentum and stop loss portfolios were greater at -65.34% and -23.69%, respectively. Average returns and Sharpe ratios doubled by using stops. This stop loss strategy had a positive skewness of 1.86, versus a negative skewness of -1.18 for the original momentum strategy, indicating a dramatic reduction in left tail risk when using stops. Both these papers show theoretically and empirically that risk control overlays, such as stop loss rules, can have dramatically positive effects on momentum-based strategies. This applies also to other trend following forms of risk control, such as moving average filters and absolute momentum, that may work as well or better than stops (the subject of a future post). Stop losses and other trend following methods are a way to head off some of the usual pitfalls of human judgement, such as the disposition effect, loss aversion, ambiguity aversion, and flight to safety. There is no reason why they should not be used by all momentum investors. [1] Stop loss strategies increased trading activity by 40%, but increases in return of about 70% helped overcome these high transaction costs.

Don’t Follow The News? More Like Don’t Overreact To The News

Tadas Viskanta has a great blog post up titled Make More By Doing (and listening) Less. The general tone of the article is the extent to which investors too frequently are influenced by stock market media enough that they make changes to their portfolio. An additional bigger point made is that people are generally better off doing less in their portfolios not more. Tadas Viskanta has a great blog post up titled Make More By Doing (and listening) Less . The general tone of the article is the extent to which investors too frequently are influenced by stock market media enough that they make changes to their portfolio that end up being the wrong thing to have done. An additional bigger point made is that people are generally better off doing less in their portfolios not more. This is in line with an idea we have discussed here many times which is that if you go along with the market and have an adequate savings rate you have a good chance of having enough for your financial goal which presumably is retirement. This idea is not meant to ignore suitable asset allocation but to have the building blocks of how equity markets tend to work, they go up most of the time and every so often they go down a lot and scare the hell out of lot of people. From there an investor or advisor can employ some sort of strategy they believe will add value to their portfolio in whatever manner they believe is appropriate and over whatever period of time they find relevant. I personally believe in using individual stocks and ETFs, trying to increase the portfolio’s yield a little, maintain global diversification and take defensive action when risks of a large decline appear to increase. You, reading this likely have your own thoughts on how value might be added to a portfolio. Chances are that whatever your philosophy on investing is (so investing, not trading), an earnings report from a small cap social media company or the subsequent discussion about those earnings on stock market television does not play into that philosophy. Tadas’s point is in part that it can be easy to be compelled to stray out of your lane by what sounds like a good story or to get scared out of something in front of what turns out to be a 2% dip that a month from now won’t be visible in a chart. However, it is different for advisors. Although they probably should, the typical advisory client is probably not reading Tadas’s blog and they are prone to reacting to all sorts of news. We all have things we react to, that is ok so the conversation then becomes about having the self-awareness to know you’re a sucker for a good story or prone to overreact to bad news or something else. For the do-it-yourselfer it probably is a good idea to avoid media that leans sensational but I do believe in knowing what is going on in the world. Maybe this means avoiding most stock market television as well as taking control of what you’re vulnerabilities are. Advisors though need to be able to address questions that come up from clients. It is reasonable for clients to ask about anything, it’s their money and part of what they are paying for is the occasional hand holding in the form of understanding a news event (will rising rates hurt my portfolio or what happens if Greece goes under) and being able to explain whether it is or is not important and whether or not it impacts the strategy. This is harder to do for an advisor who consumes no news. Some will be able to have an effective dialogue with their client in this context without actually knowing the story but it is more difficult to do. Additionally while an advisor is presumably all in on whatever strategy they deploy for clients there are market environments where their strategy will struggle versus whatever their clients are seeing and hearing about from their friends. And picking your head up and looking around occasionally is a way to address these conversations more easily as well. I would say as opposed to not following the news, it might be better to train yourself to not overreact to the news. Disclosure: The author has no positions in any stocks mentioned, and no plans to initiate any positions within the next 72 hours. (More…) The author wrote this article themselves, and it expresses their own opinions. The author is not receiving compensation for it. The author has no business relationship with any company whose stock is mentioned in this article. Additional disclosure: To the extent that this content includes references to securities, those references do not constitute an offer or solicitation to buy, sell or hold such security. AdvisorShares is a sponsor of actively managed exchange-traded funds (ETFs) and holds positions in all of its ETFs. This document should not be considered investment advice and the information contain within should not be relied upon in assessing whether or not to invest in any products mentioned. Investment in securities carries a high degree of risk which may result in investors losing all of their invested capital. Please keep in mind that a company’s past financial performance, including the performance of its share price, does not guarantee future results. To learn more about the risks with actively managed ETFs visit our website AdvisorShares.com .

How To Choose Between VOO And SPY

Summary The Vanguard S&P 500 ETF has a strong correlation to SPDR’s S&P 500 ETF. Despite the very strong correlation in returns, there is a clear way to pick which ETF is a better investment. The difference is more than expense ratios. The fund underperforming in one month regularly outperforms in the next using dividend adjusted close values. Investors in the Vanguard S&P 500 ETF (NYSEARCA: VOO ) have plenty of reasons to be happy with their investment. The fund tracks a reasonably stable portion of the U.S. economy and offers investors a lower expense ratio than a major competitor, the SPDR S&P 500 Trust ETF (NYSEARCA: SPY ). The ratio isn’t substantially lower, but the difference is meaningful if the investment horizon is long enough. For VOO the expense ratio is .05% and for SPY it is .09%. The difference should imply that VOO would outperform over the long term by increasing the compound annual growth rate by about .04%. The difference isn’t huge, but it does add up over time. The correlation Returns between the two ETFs have an extremely high correlation, over 99.9%. The strong correlation in returns gives investors reason to believe that the two ETFs should move almost perfectly in unison. However, there are occasionally meaningful differences in the share price of the two major ETFs and those differences result in opportunities for investors. Looking back I ran some regression on returns since the start of October 2010. Since then, the Vanguard S&P 500 ETF has largely mirrored the SPDR S&P 500 ETF. Both were up between 94.1% and 93.6% and the movements generally occur at almost precisely the same time. The interesting thing was when I decided to track the differences in the dividend adjusted closes for each month. The premise is that for each month I would look at the returns on VOO and subtract the returns on SPY. This gave me the difference in the percentage return for the month. I put together a chart to demonstrate, but the volume of data points may make it a little difficult to read. (click to enlarge) What investors should notice is that the bars are regularly trading direction. Not only do the bars swing back and forth, the longest bars going in any direction are precisely between two bars heading in the opposite direction. When the bars are fairly short, it provides little indication of which way the bars will move in the future. The theory My prediction upon glancing at the numbers was that we should expect to see serial negative correlation in the difference of the returns. In simpler words, we should expect the two ETFs to move together and treat any deviation from that connection as an error by the market. When one ETF has meaningfully outperformed the other in the previous month, the one with weaker performance should be purchased. I tested that by running a correlation between the difference for each month and the difference reported in the next month. If my theory was correct, there should be a negative correlation. The test showed a negative correlation of 35.7% (rounded). With a decent sample size, I’m comfortable taking that as confirmation. In my opinion, the deviations in the market value of these two ETFs can be used as a clear indication on which ETF investors should be buying if they are investing with a time frame of a few years. If the time frame is multiple decades If investors are planning to buy and hold the shares for a few decades, the difference in expense ratios should overwhelm the regression between the two ETFs and I would expect VOO to provide slightly superior returns over the next 20 or 30 years due to the difference in expense ratios. Conclusion Vanguard S&P 500 ETF is a great investment for keeping up with the S&P 500 over the long time. It offers a lower expense ratio than SPY and very similar returns. When the time frame is measured in months or only a couple of years, investors may want to look at the recent difference in returns and choose the ETF that has seen weaker share price performance since there is a very solid history of the differences in performance reversing over the following month. For investors that can trade VOO without commissions, the benefit of removing commissions could eliminate the short term advantages of investing in the fund with a weaker short term history. However, that depends entirely on the share volume trading hands. If there was a meaningful movement in price between the two ETFs, I would expect the weaker one on average to capable of outperforming by about .10% in the following month. For the investor contemplating investing in VOO and capable of trading it without commissions, the most attractive time to do so is when it has just fallen short of SPY. If we assume SPY is the most accurate gauge of the movement in the economy, then any time that VOO becomes cheaper relative to SPY is a time when the ETF is more attractive to purchase. It doesn’t matter if SPY moved up or down last month, it simply matters whether VOO underperformed SPY. Disclosure: The author has no positions in any stocks mentioned, and no plans to initiate any positions within the next 72 hours. (More…) The author wrote this article themselves, and it expresses their own opinions. The author is not receiving compensation for it (other than from Seeking Alpha). The author has no business relationship with any company whose stock is mentioned in this article. Additional disclosure: Information in this article represents the opinion of the analyst. All statements are represented as opinions, rather than facts, and should not be construed as advice to buy or sell a security. Ratings of “outperform” and “underperform” reflect the analyst’s estimation of a divergence between the market value for a security and the price that would be appropriate given the potential for risks and returns relative to other securities. The analyst does not know your particular objectives for returns or constraints upon investing. All investors are encouraged to do their own research before making any investment decision. Information is regularly obtained from Yahoo Finance, Google Finance, and SEC Database. If Yahoo, Google, or the SEC database contained faulty or old information it could be incorporated into my analysis.