Tag Archives: most-popular

An Update On 4 Tactical/Momentum ETFs

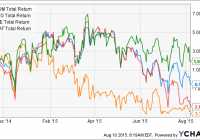
Summary Four tactical/momentum ETFs debuted in late 2014. These ETFs have the ability to switch between equities, bonds or other assets based on trailing momentum and/or volatility. How have these ETFs fared in the 9 months since inception? Introduction In a previous article , I discussed the debut of 4 tactical/momentum ETFs. Broadly speaking, these ETFs aim to exploit the momentum factor, which is often regarded as the premier anomaly due to its persistent outperformance over long periods of time. Stocks that have done well recently tend to continue to do well, while stocks that have done poorly recently tend to continue to do poorly. The momentum concept is embodied in aphorisms such as “Cut your losers and let your winners run.” Momentum works well not only within asset classes, but also between them. A momentum strategy that switches between stocks and bonds, for example (also known as “tactical” allocation), may well have allowed an investor to avoid the worst stock market crashes in history. A number of Seeking Alpha authors have presented various simple momentum strategies that have highly impressive backtested performance, such as varan , Frank Grossman and others. Recently, Left Banker described his own momentum strategy that had him reaping the rewards of treasury bonds in 2014. For investors who lack the time or inclination to implement their own tactical/momentum strategies, ETFs may be a valid alternative. Four such ETFs were launched in October or November of 2014. Cambria Global Momentum ETF (NYSEARCA: GMOM ) Global X JPMorgan US Sector Rotator Index ETF (NYSEARCA: SCTO ) Global X JPMorgan Efficiente Index ETF (NYSEARCA: EFFE ) Arrow DWA Tactical ETF (NASDAQ: DWAT ) For further details on the methodology of each of these ETFs, please see my previous article . Note that all four funds have the ability, at the minimum, to switch between equities and bonds. Hence, equity-only momentum funds, of which there are many, were excluded from this comparison. Given that it has been around 9 months since the debut of these four ETFs, I thought it would be a good time to assess their performance since their inception. Results The total return history of the four ETFs since the inception date of the newest fund (Nov. 2014) is shown below. GMOM Total Return Price data by YCharts The chart above shows that DWAT has had the highest total return of 1.94%, while SCTO has the lowest return of -3.33%. How does this compare with some of the most common benchmarks? The following 12 asset classes were selected as a comparison: U.S. equities (NYSEARCA: SPY ) Developed markets ex-U.S. equities (EAFE) Emerging market equities (NYSEARCA: EEM ) U.S. long-term treasuries (NYSEARCA: TLT ) U.S. intermediate-term treasuries (NYSEARCA: IEF ) U.S. investment grade bonds (NYSEARCA: LQD ) U.S. high-yield bonds (NYSEARCA: JNK ) Emerging market bonds (NYSEARCA: EMB ) U.S. real estate (NYSEARCA: VNQ ) Ex-U.S. real estate (NASDAQ: VNQI ) Commodities (NYSEARCA: DBC ) Global market portfolio (NYSEARCA: GAA ) The following bar chart shows the total return performances of the four tactical/momentum ETFs plus the 12 asset classes since Nov. 2014. The tactical/momentum ETFs are shown in green, equities in blue, bonds in red and other asset classes in yellow. We can see from the chart above that there has been quite a wide dispersion of return performances, with the highest being TLT at 6.35% and the lowest being DBC at -30.2%. The following chart is the same as that above except with DBC removed, in order to make the differences between the other funds easier to visualize. Discussion At first glance, it seems that the four tactical/momentum ETFs underperformed. U.S. stocks, as represented by SPY, returned 5.35% over the past 9 months, while the four U.S. bond ETFs averaged 1.57%. In contrast, the four tactical/momentum ETFs averaged only -1.19%. However, as Seeking Alpha author GestaltU has convincingly argued , a 60/40 U.S. stock/bond mix is not an appropriate benchmark for global tactical asset allocation [GTAA] strategies. Instead, the benchmark should be the investible global market portfolio [GMP]. This portfolio is nicely represented by the Cambria Global Asset Allocation ETF, ticker symbol GAA, which is the last asset class data point shown in the charts above. GAA returned -1.02% over the past nine months. This suggests that the four tactical/momentum ETFs did not significantly underperform this benchmark over the past nine months. Conclusions This article provides an update to four tactical/momentum ETFs that were launched around nine months ago. With domestic equities continuing to grind higher, many investors have been considering reducing their exposure to this space. For investors uncomfortable with market timing (like myself), the use of a tactical/momentum fund may allow investors to, in an ostensibly “passive” manner, stay invested in the outperforming markets such as the U.S. until the tide turns. However, this study also revealed a drawback of the tactical/momentum funds. None of these ETFs were apparently able to capture the full, or even any, upside of the domestic equity market (+5.35%) over the past nine months; in fact, as a group, the four ETFs exhibited a negative total return of -1.19%. This is especially surprising for SCTO (-3.33%), which invests only in U.S. sectors and/or U.S. short-term treasuries, and nothing else. Thus, investors should not expect the tactical ETFs to keep pace with the U.S. bull market, if it continues. Disclosure: I am/we are long GMOM. (More…) I wrote this article myself, and it expresses my own opinions. I am not receiving compensation for it (other than from Seeking Alpha). I have no business relationship with any company whose stock is mentioned in this article.
Social Media ETF: Will You Sign In Or Out Post Earnings?

The social media space, once a rising star, is seeing tough times for the last three months as evident by 6.3% loss incurred by the pure-play ETF Global X Social Media Index ETF (NASDAQ: SOCL ). The fund started the year on a solid note as the tech space soared but offhand Q1 earnings by some its components caught the fund off guard. This makes it more important for investors to keep a close watch on the Q2 earnings performance by the constituent companies and see what’s in store for SOCL in the coming days. Below we highlighted some key companies’ earnings this season and its impact on the fund. Results in Detail On July 30, professional networking giant LinkedIn Corporation (NYSE: LNKD ) beat the Zacks Consensus Estimate beat on earnings and revenues. However, investors dumped LNKD shares post results on a weak third-quarter revenue outlook. LinkedIn expects revenues within $745-$750 million while the Zacks Consensus Estimate was pegged at $750 million before earnings. But the company raised its full-year revenue expectation to $2.94 billion from $2.90 billion. Non-GAAP earnings per share for 2015 are projected at $2.19 per share compared with the previous guidance of $1.90 per share. Notably, LinkedIn is SOCL’s third-largest holding with 8.18% focus and has considerable power to make or break this ETF. On July 29, the social media giant Facebook (NASDAQ: FB ) reported a mixed-bag with an earnings miss and a revenue beat. Though revenues grew 39% in the quarter, the rate of growth was slower, marking the fifth straight quarter of deceleration. Higher expenses and growing concerns over slower revenue growth weighed on the Facebook stock and investors hurried to sell FB shares post earnings. Facebook has as much as 12.82% weight and the top spot in the fund SOCL. In July, Yahoo’s (NASDAQ: YHOO ) second-quarter adjusted numbers missed the Zacks Consensus Estimate, but its net revenue was higher than the Zacks Consensus Estimate. However, the company’s turnaround trends are solid. YHOO has a position in SOCL’s top 10 holdings with about 4.19% weight. In mid July, Google Inc. (NASDAQ: GOOGL ) (NASDAQ: GOOG ), the world’s biggest Internet search engine, stirred up investors with upbeat Q2 results. The stock soared 16.3% the day after it reported earnings. Google has 6.5% weight in SOCL, occupying the fifth position. On August 7, 2015, Groupon’s (NASDAQ: GRPN ) second-quarter top and bottom line missed our estimates. Also, the company projects revenues for the third in the range of $700-$750 million which fell short of the analysts’ expectation. As a result, the shares slumped 5.34% at the close of August 7. The company has 3.17% weight in the social media ETF. Twitter (NYSE: TWTR ) also reported last month. A deceleration in monthly user growth and a slightly soft Q3 guidance prompted investors to stay away from the Twitter stock although the company beat on the top and the bottom lines. The stock crashed post earnings. Early this month, Twitter hit a fresh low. However, SOCL has a meager percentage in with about 2.78%. ETF Perspective In such a backdrop, we would suggest investors to take a cautious approach on investing in the social media space as strength and weakness weigh almost the same. The recent stretch of huge sell-off in some components may be the result of overvaluation. Adding TWTR, FB or GRPN to one’s portfolio might not be a safe idea right now, but having a basket approach via SOCL – a pure play social media ETF – might be a smart move as far as risk minimization is concerned. SOCL has a Zacks ETF Rank of 3 or ‘Hold’ rating with a ‘High’ risk outlook and can protect the money of investors (interested in playing the social media space at the current level). This would also mitigate risks that the laggards bear. SOCL focuses on global companies engaged in some aspect of the social media industry. The fund tracks Solactive Social Media Index and invests $82.8 million of assets in 32 holdings. SOCL has company-specific concentration risk, putting more than 60% of investments in its top 10 holdings. The product charges 65 bps in annual fees. SOCL is up about 4% so far this year. Original Post

Global Asset Allocation Update

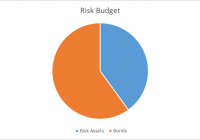
By Joseph Y. Calhoun I am lowering our risk budget this month, based on several factors. For the moderate risk investor, the allocation between risk assets and bonds moves to a defensive 40/60 versus the benchmark of 60/40 and last month’s 50/50. Credit spreads have resumed widening, as crude oil prices have resumed their downtrend. The downtrend in high-yield credit prices may be concentrated in energy issues, but it isn’t confined to that sector. Momentum has shifted notably over the last month to long-term bonds, as inflation expectations have fallen considerably. The yield curve flattened during the month. Although the curve has not fully flattened yet – indeed, it sits in the middle of its historical range – I am still uncertain as to the degree of flattening we’ll see before the next recession. I am choosing to be conservative in my approach to asset allocation. Valuations are still high by historical standards, and revenue and earnings growth is very weak. (click to enlarge) Of the four items we monitor for asset allocation, three are flashing warnings. The change in credit spreads last month approached 10%, well above the 7.5% level we use as a warning sign. Momentum, as I’ve noted numerous times the last few months, has rolled over for the S&P 500, and now, upward momentum can be observed in long-term bonds. It is not as concerning as it might be, though, since the rally in the long end has also included high-grade corporates. Lastly, reliable valuation methods continue to show a stock market near all-time high valuation levels. The only indicator not flashing a warning is the yield curve, which is still far from flat – the condition most commonly associated with pre-recession. (click to enlarge) With rates so low, though, an outright inversion seems highly unlikely, and even getting to flat would seem a heroic feat. If that happens, I cannot imagine that stocks will not have already succumbed to altitude sickness. Credit spreads moved wider on the month, enough to trigger a Sell signal for the stocks. High yield spreads are not yet at levels associated with past recessions, but the rate of change is concerning. Historically, rapidly widening spreads are a sign of stress, and are associated with stock market corrections. Furthermore, Baa spreads are already at recession-associated levels, and investment-grade spreads remain elevated across the credit spectrum. (click to enlarge) (click to enlarge) (click to enlarge) Momentum shifted during the month to bonds, a trend that is actually pretty well established, although it stumbled a bit earlier this year: (click to enlarge) Longer-term bonds continue to outperform shorter maturities, exactly what we would expect with inflation and nominal growth expectations falling: (click to enlarge) On the equity side, EAFE continues to outperform the US market this year, although not by a lot: (click to enlarge) Asia, which outperformed last year and into this one, has flagged badly recently, and I am closing out that position: (click to enlarge) Japan, however, continues to outperform. As I’ve stated numerous times, I think the country has entered a secular bull market: (click to enlarge) Emerging markets have not recovered, and now sit at the bottom of their several years-old range. As I’m moving to a more defensive posture, it does not make sense to maintain exposure to these markets. If the dollar starts to fall, I will reconsider the position: (click to enlarge) Europe outperformed on the month, and I would maintain that exposure: (click to enlarge) Small cap stocks underperformed badly versus large caps in July. In a defensive mode, small cap allocations should be minimized. (click to enlarge) Lastly, I am maintaining a small position in gold, as I believe the US dollar is peaking. The sentiment toward gold is extremely bearish right now, so a small position makes sense from a contrarian perspective. Moderate risk allocation : (click to enlarge) I also run two asset allocation models (one aggressive, one more moderate) based on momentum. These models ignore all fundamental and economic information in favor of just allocating to asset classes that are exhibiting momentum. Here’s where those models stand at the end of the week (rebalancing is monthly): Aggressive Version : 50% TLT 50% EWJ Moderate Version : 25% TLT 25% TLH 25% SCZ 25% IEF As you can see, both of these models are overweight bonds, especially of the long-term variety. More information on these momentum models can be found here .