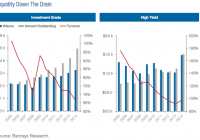
Ted Cruz recently suggested praying for rain in Texas, and apparently someone did a few weeks ago, producing a deluge resembling a modern day Noah’s Ark of sorts. California’s Governor Brown on the other hand, has taken a more secular approach. He believes that Mammon, not God, bears responsibility for the Golden State’s record drought and that I, we, all of us simple folk should cut back water usage by a minimum of 25%. Well it’s hard to argue with Governor Moonbeam especially when it comes to the environment, although if you ask me, his other idea of hundreds of miles of high speed rail at a minimum cost of $25 billion is off the rails and on the governor’s private moon. But I will do my part. As a free citizen though, I have choices: replace the lawn with artificial grass, take fewer showers, jerry-rig the toilet bowl, or perhaps eat fewer almonds. I will choose a diet of fewer almonds. Growing almonds it seems, consumes 10% of all the annual residential water supplied to 40 million thirsty folks in California, and 60% of that production is exported, so I suggest we fight the drought “there” as opposed to “here”, if you get my drift. To that same point, an article in the impeccably objective Wall Street Journal claims that the water consumption for one pound of almonds is equivalent to 50 five minute showers, so I’m not giving up my shower for a bag of almonds. It’s here, though, where I have to do a little bragging. Some people will talk about having the world’s greatest dog or their newborn baby who slept through the night during the first week. But Sue and I have something very different. We have the world’s greatest shower. To be quite candid, it’s not the water, the temperature, the simple knobs, or even the shower head that makes it the best; nor is it the combination of all four. The key to our shower in fact, is not the actual experience of hot water on a 98.6° body at all. It’s the view; our shower has the world’s greatest view. The scenery from it is so gorgeous that when we sell our home, we may list the shower separately and see if it attracts an offer higher that the rest of the house. If not, we’ll just sell the house with a shower “easement” and continue to come in and out from the street every morning at 6:00 a.m. Back to the view. That it has one in the first place is, I suppose, outrageous in and of itself. But here Sue and I were in 1990, constructing our house on a Laguna Beach cliff overhanging more white water than you could shake a kayak at. The sailboats were drifting by, the surfers were hanging ten and it seemed like every minute of every waking day should be focused on that gorgeous piece of the Pacific that comes to rest 60 feet below our bathroom. So we built a shower with a window – not a picture window – but one big enough for a view. As is customary with a new home, I carried Sue over the threshold on the first day we moved in. But once the workers had cleared out, we headed straight for the shower. “Champagne?” she asked. “Nah”, I said romantically. “Just wanna look at the view.” When it comes to retirement, I don’t think we’ll need our 401Ks. We’ll just sell tickets to our shower, and use the proceeds to pay for some of Governor Moonbeam’s almonds. Speaking of liquidity, whether it be in surplus in a Laguna Beach shower, or an extreme deficit in the State of California, current concerns in the financial markets center around the absence of liquidity and the effect it might have on future market prices. In 2008/2009, markets experienced not only a Minsky moment but a liquidity implosion, as levered investors were forced to delever. Ultimately the purge threatened even the safest and most liquid of investments. Several money market funds appeared to “break the buck” which in turn threatened the $4 trillion overnight repo market – the center core of our current finance-based economy. Responding to this weakness, the Fed and other central banks imposed emergency liquidity provisions of their own – in effect they became the buyers of last resort. Recently however, Congressional legislation concerning “too big to fail” and Federal court rulings in favor of AIG regarding the expropriation of shareholders’ capital, have cast doubts as to whether central banks and their governments can exercise similar “puts” in the future to stabilize asset prices. As a result, regulators are proceeding with “better safe than sorry” mandates – tightening bank capital standards, curtailing the size of the potentially volatile repo market from $4 to $2 trillion, and pursuing inquiries as to which financial institutions are “strategically important” – code for “big enough to threaten asset market stability”. Not only major banks but several insurance companies and asset managers including PIMCO – just one block down the street – are being scrutinized. These individual companies which include Prudential, MET, BlackRock, and at least several others have responded as you might expect. “No problem” sums it up – markets are a little less liquid they claim, but recent experience would show that for PIMCO at least, there were no “fire sales” or “forced selling” after my recent departure, as stated by CEO Doug Hodge in a friendly WSJ article. Ah, now I’ve caught your interest. Well first of all let me state that the PIMCO example is not a good one to use to prove the current liquidity of mutual funds, ETFs, and even index funds. Hodge himself admitted to internal proprietary “liquidity” provisions, adding that it used derivatives for exposures “to support cash buffers and inflows” (sic). The fact is that derivatives on a systemic basis represent increased leverage and therefore increased risk – presenting possible exit and liquidity problems in future months and years. Mutual funds, hedge funds, and ETFs, are part of the “shadow banking system” where these modern “banks” are not required to maintain reserves or even emergency levels of cash. Since they in effect now are the market, a rush for liquidity on the part of the investing public, whether they be individuals in 401Ks or institutional pension funds and insurance companies, would find the “market” selling to itself with the Federal Reserve severely limited in its ability to provide assistance. While Dodd Frank legislation has made actual banks less risky, their risks have really just been transferred to somewhere else in the system. With trading turnover having declined by 35% in the investment grade bond market as shown in Exhibit 1, and 55% in the High Yield market since 2005, financial regulators have ample cause to wonder if the phrase “run on the bank” could apply to modern day investment structures that are lightly regulated and less liquid than traditional banks. Thus, current discussions involving “SIFI” designation – “Strategically Important Financial Institutions” are being hotly contested by those that may be just that. Not “too big to fail” but “too important to neglect” could be the market’s future mantra. Down the street from PIMCO, I must openly acknowledge that helping to turn Janus into one of these “too important” companies is one of my objectives, as it is for CEO Dick Weil. But that day lies ahead of us. For now, regulators and thus large institutional asset managers are at least contemplating an inability to respond to potential outflows. Just last week Goldman Sachs’ Gary Cohn cleverly suggested that liquidity is always available at “a price”. True enough in most cases, except perhaps for 1987 when stock markets declined 25% in one day as the vaunted portfolio insurance scheme met its maker due to sellers all rushing to the exit at the same time. Aside from the obvious drop in trading volumes shown above, the obvious risk – perhaps better labeled the “liquidity illusion” – is that all investors cannot fit through a narrow exit at the same time. But shadow banking structures – unlike cash securities – require counterparty relationships that require more and more margin if prices should decline. That is why PIMCO’s safe haven claim of their use of derivatives is so counterintuitive. While private equity and hedge funds have built-in “gates” to prevent an overnight exit, mutual funds and ETFs do not. That an ETF can satisfy redemption with underlying bonds or shares, only raises the nightmare possibility of a disillusioned and uninformed public throwing in the towel once again after they receive thousands of individual odd lot pieces under such circumstances. But even in milder “left tail scenarios” it is price that makes the difference to mutual fund and ETF holders alike, and when liquidity is scarce, prices usually go down not up, given a Minsky moment. Long used to the inevitability of capital gains, investors and markets have not been tested during a stretch of time when prices go down and policymakers’ hands are tied to perform their historical function of buyer of last resort. It’s then that liquidity will be tested. And what might precipitate such a “run on the shadow banks”? A central bank mistake leading to lower bond prices and a stronger dollar. Greece, and if so, the inevitable aftermath of default/restructuring leading to additional concerns for Eurozone peripherals. China – “a riddle wrapped in a mystery, inside an enigma”. It is the “mystery meat” of economic sandwiches – you never know what’s in there. Credit has expanded more rapidly in recent years than any major economy in history, a sure warning sign. Emerging market crisis – dollar denominated debt/overinvestment/commodity orientation – take your pick of potential culprits. Geopolitical risks – too numerous to mention and too sensitive to print. A butterfly’s wing – chaos theory suggests that a small change in “non-linear systems” could result in large changes elsewhere. Call this kooky, but in a levered financial system, small changes can upset the status quo. Keep that butterfly net handy. Should that moment occur, a cold rather than a hot shower may be an investor’s reward and the view will be something less that “gorgeous”. So what to do? Hold an appropriate amount of cash so that panic selling for you is off the table. A wise investor from nearly a century ago – Bernard Baruch – counseled to “sell to the sleeping point”. Mimic Mr. Baruch and have a good night.