Tag Archives: most-popular

Diversified Royalty: Finally, It Is Diversified

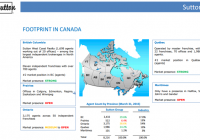
Summary Diversified Royalty transitioned from a capital pool to a royalty stream vehicle in June 2014. BEVFF took steps to prepare its capital structure to add additional royalty streams in the most cost-effective manner. Following a delay after the initial fundraising, BEVFF added a second lucrative royalty stream in early June 2015, truly diversifying itself. Diversified Royalty ( OTC:BEVFF ) (or DIV on the TSX Exchange) came into being on June 30, 2014 when a former capital pool, Benev Capital Inc., put together a transaction to acquire $12m in annual topline revenue for the purchase price of $103m ( $82m USD ) in the form of a royalty stream of income from Calgary-based Franworks Franchise Corp., the owner of the Original Joe’s, State and Main, and Elephant and Castle restaurant chains. Streaming transactions have been common in the basic materials sector for some time, utilizing with great success by Franco Nevada (NYSE: FNV ) and Silver Wheaton (NYSE: SLW ), to name a few. They serve to provide funding for business initiatives without utilizing formal debt instruments. In fact, they partially tie the vendor to the sustainability of the enterprise going forward. Due to their success in the materials sector, these transactions have gained some traction in other sectors as well, as diverse as restaurants and farming. The Franworks transaction was structured as follows: $64m ( $51m USD ) cash on hand Franworks was issued approximately 9m shares worth $14.9m ($12m USD) Maxam Opportunities LP, a venture fund, subscribed for 5.2m shares or $8.7m ($7m USD) in a private placement $15m ($12m USD) coming from borrowings Franworks’ position in DIV amounted to 16.9% of the company at the time of the deal (now 15.4% after some other transactions) so they are very vested in the success of DIV as well. Franworks has the funds from the royalty sale to accelerate growth of its brands by adding new locations, as well as by renewing older locations. Both these help to drive revenue and should provide growing royalties to DIV down the road. Franworks’ restaurants are in the “upscale, casual” dining space. This is where you pay close to upscale dining prices, but without the dress code required. Go in to any of these restaurants and you will see people dressed up for a nice night out sitting next people just off the beach in tank tops and flipflops. The margins are much better than most mass eateries while still having a broad appeal. Maxam Capital Management, the manager of the Maxam Opportunities Fund, uses an “active, opportunistic and flexible” approach to capital management. DIV’s CEO, Sean Morrisson, is also a Managing Partner at Maxam and has a very strong background in capital management, advising the Keg Restaurants, a restaurant royalty income fund in Canada (KEG.UN), among other activities in his venture capital career. Maxam is a good partner for DIV to have in expanding its business, both to generate leads as well as to help evaluate transactions initially and on an ongoing basis. The restaurant-based royalty stream transactions are quite common in Canada with several others utilizing the income fund structure, such as the A&W Revenue Royalties Income Fund (AW-UN.TO), the Boston Pizza Royalties Income Fund (BPF-UN.TO) and the Keg Royalties Income Fund (KEG-UN.TO). DIV is not setup as an income fund, which makes it more flexible to acquire new streams of income down the road, as there are some limitations with the tax structure for income funds. As well, they can simulate the tax-free structure by utilizing its $35m CAD ($28m USD) in tax losses. Like these other royalty funds, the Franworks royalty is a gross revenue royalty, earning 6% of the top-line revenue from the restaurants included in the pool. These can change over time as locations are added or subtracted. Some royalty streams are based on net revenues, where some deductions are taken prior to payment, but DIV will receive its royalty regardless of how profitably the locations are operated. That said, it is clearly to their advantage to have successful restaurants available in the future. DIV’s future is clear: The royalty acquisition from Franworks is a platform transaction for BCI and the first step in our recently announced strategy to purchase top-line royalty streams from a number of growing multi-location businesses and franchisors. Franworks is a fast growing chain with strong unit-level economics and a superb management team – key success factors for a top-line royalty acquisition. With the successful completion of this transformational transaction, BCI intends to focus its efforts on acquiring additional royalties from growing multi-location businesses and franchisors. In October 2014, DIV received final approval for the transaction and completed its name changed to Diversified Royalty Corp. This followed quickly with a promotion of the company on to the TSX big board , providing it a better avenue to raise equity funds than they would have had with a Venture Exchange listing. They quickly utilized this, closing a $34.5m bought deal financing in November 2014 ($27.6m USD). Now all they needed was another royalty stream. So shareholders waited. And waited. And waited. Message boards on stock forums complained about DIV’s lack of action. Analysts on business TV poked fun at its name “how can it be Diversified with just one royalty stream.” On April 1, 2015, DIV added 5 new restaurants to its Franworks deal, increasing annual royalties by $0.6m ($0.5m USD) annually, at a consideration of $6.2m ($5.0m) , $4.8m ($3.9m USD) payable upfront in DIV shares, valued at $2.69 CAD ($2.15 USD), with the remainder due in a year depending on performance of these locations. However, this didn’t move the needle for most shareholders. However, patience was rewarded as on June 9, 2015, DIV announced it had purchased its second royalty stream from real estate company Sutton Realty. (click to enlarge) Sutton is a very strong realtor brand in Canada and has had a relatively stable level of agents throughout the past decade, despite not having the funding available to acquire smaller brokerages or to grow organically. This transaction with DIV will allow it to jumpstart its growth, which will be a positive for both Sutton and DIV. DIV receives, in exchange for $30.6m ($24.5m USD), a fixed royalty payment for licensing the Sutton brand back to Sutton of $3.5m ($2.8m USD) annually plus a $100,000 CAD ($80,000 USD) annual management fee. The royalty payment escalates 2% each year, the management fee 10% every four years and the entire deal is for 99 years. This fee has 40% coverage by Sutton based on EBITDA so there is a good margin of safety to ensure DIV receives their fees each year. Sutton can increase the rate by 10% on four occasions during the life of the deal or choose to add additional agents to the pool in exchange for further investment by DIV based on a pre-set formula. DIV will fund this transaction using $24.3m ($19.4m USD) in cash and an additional $6.3m in debt. This will leave DIV with a roughly $10m ($8m USD) cash on its balance sheet with debt of $21m ($16.8m USD) , a small portion compared to its equity valuation and covered by its future cashflows. Going Forward In its presentation to shareholders, DIV provided the following competitor analysis and forecasted cashflow coverage: (click to enlarge) The first 5 royalty companies all are strictly food-based royalty companies, while Alaris is significantly more diversified than the others. DIV is more hedged with its two current streams than the restaurant only funds, though not as much as Alaris. Its 6.9% dividend yield is significantly higher than the mean of 5.5%. These payouts are made monthly rather than quarterly like most dividends so they are in your hands sooner. The high payout rate is common with these types of corporate structures, as shown above. In some cases, high dividends can be a sign of trouble at the company as the market doesn’t believe they are sustainable; however, in this case it is due to a lack of market awareness. DIV has only one quarter as a royalty company, and this is only with the Franworks royalty stream. However, I wanted to see if they were roughly on track. From the first quarter 2015 MD&A: While they clearly paid out more than planned in this quarter, several extra events impacted the result: $700K CAD ($560K USD) in costs associated with litigation from a former CEO (who left the company in 2004, long before the business model change) $300K ($240K USD) in financing related costs $400K ($320K USD) in taxes; the company has losses that will be applied going forward to minimize these costs. I don’t believe the 2015 first quarter excess distribution over distributable cash is a concern. DIV has undergone a very drastic transformation and will have some costs associated with this, which should normalize in the next couple of quarters. The fact that revenue delivered as expected, despite economic headwinds in the Alberta oil patch, is positive. DIV should also see some economies of scale when the Sutton royalty starts to show up in its results. DIV is not without some risk. Most of the Franworks locations are in Western Canada, which makes it somewhat susceptible to the fortunes of the oil patch; that said, Q1 gives a pretty good indication that they should not be significantly affected by this as this was when the oil price drop was most severe. The frothiness of Canadian real estate is also well known . If there were a downturn in housing, eventually you would likely see some agents take down their shingles. That said, Sutton has maintained its levels of realtors consistently over the past decade so they likely wouldn’t need to retrench much in a downturn. The coverage provided by the EBITDA levels also will ensure Sutton makes its minimum payments to DIV. DIV gives an investor diversified exposure to the Canadian consumer with steady, growing businesses that hit two of the necessities of life — food and shelter, all while receiving an above-average yield ( 6.9% ). Well worth the wait. All figures in CAD, except where indicated. Editor’s Note: This article covers one or more stocks trading at less than $1 per share and/or with less than a $100 million market cap. Please be aware of the risks associated with these stocks. Disclosure: I am/we are long BEVFF. (More…) I wrote this article myself, and it expresses my own opinions. I am not receiving compensation for it (other than from Seeking Alpha). I have no business relationship with any company whose stock is mentioned in this article.
Correlation Of Commodities With World Stock Indexes: The Short Opportunity

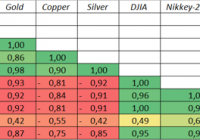
Summary This article is made to show the correlation relationships of oil, gold, copper and silver price with DJIA, S&P 500, NASDAQ, CSI-200, Nikkey-225 and ASX-200. The main idea is that the cycles of these fundamental commodities’ prices are the origins of the change in the stocks’ quotations. Investors can use this information to make investment decisions according to the current fundamental situation. The main conclusions about the future prices of the indexes are given in the section “Conclusions”. Introduction: This article was made to show the way to determine if the stock indexes are overvalued or undervalued according to the fundamental power of commodities. In fact, the correlation relationships among commodities and different indexes were discovered long before me (e.g., Sam Ro on Business Insider showed the correlation of different commodities with S&P 500). Using this information, investors can determine if the stock index is overvalued (undervalued) or not. Main tools for this research were the correlation analysis and the linear regression analysis. Correlation analysis measures the power of the relationship between 2 assets. If the correlation is 1, it means, that the price change of the first asset for 1% will make the price of the second asset change by 1%. If the correlation is -1, absolutely negative, it means that the change of price for 1 asset by 1% will tend to a -1% price change of another asset. The linear regression analysis is a formal tools to investigate the actual formula for the correlation relationship. Usually written in the form “Y = a + bx”, where a and b are investigated by the least-squared method (more formally, ordinary least squares method – OLS). For example, if a is 2 and b is 3, the formula looks like “Y = 2 + 3x”. If x is 3, Y tends to be 2 + 3 * 3 = 11. These technics are extremely useful when there is a significant change of the factors, which happens nowadays. And I do want to determine the fact that according to my analysis, most top indexes are extremely overvalued. Body of research: Without a shadow of a doubt, it is evident that main indexes are the “mirrors” of the future economic development of the country. Obviously, if the country’s structure of GDP is mostly connected with the mining and manufacturing industry, the prices for such commodities as oil, gold, copper and silver strongly affect the perspectives of the future economic growth. Oil is used as the main source of energy; Gold and silver are widely used in the electronic industry; Copper, in fact, is used everywhere. The main hypothesis of this article is: first – if the prices for these commodities really affect the price of the main world’s indexes? second – if the first is true, how can we measure this effect? As you can see in the Table 1, there are several strong relationships among assets: Brent is positively correlated with all types of commodities, mostly with copper, and negatively correlated with all main indexes. The strongest negative correlation is with CSI-200, so it confirms the fact, that cheap oil makes the economics of China grow faster. The weakest correlation is with ASX-200, so Australian stocks are the most “oil-neutral” among other considered indexes; WTI shows the same tendency as Brent; Gold has the strongest negative correlation among all commodities with the top American indexes. In my opinion, the main reason for this fact is that gold has always been the main substitute for USD currency. Strong dollar means a low price of gold, so they are negatively correlated by nature. As the Japanese yen is one of the 4 widely used currencies in the World, Nikkey-225 is strongly negatively correlated with the price of gold. CSI-200 is a Chinese index and it is least negatively correlated with this metal; Silver shows the same tendency with gold for the similar reasons, stated above; Copper, the main indicator of economical development, shows a negative correlation with all indexes. However, it is not as strong as other commodities. Table 1. The Correlation Matrix (click to enlarge) Source: information found in the Internet, author’s calculations According to these facts, we can make several conclusions: All the commodities are positively correlated with each other and negatively correlated with main indexes; The most powerful indicators are Gold, Brent (CSI-200), and Silver When determining the formula for DJIA, Nikkey-225, S&P 500 and ASX-200 I will use Gold. Brent price will be used for creating the CSI-200 formula. The linear regression model for DJIA with the gold factor shows the 86% reliability of this factor. (click to enlarge) The linear regression model for Nikkey-225 with the gold factor shows the 85% reliability of this factor. (click to enlarge) The linear regression model for S&P 500 with the gold factor shows the 85% reliability of this factor. (click to enlarge) The linear regression model for CSI-200 with the Brent factor shows the 63% reliability of this factor. However, the main reason for such a low level of reliability is a low price of Brent (rounded by a red circle). (click to enlarge) The linear regression model for ASX-200 with the gold factor shows the 76% reliability of this factor. (click to enlarge) Forecast: I consider 3 scenarios which can affect the prices of the Brent and gold. For the target Brent price of $65 and the Gold price of $1184 (“Basic scenario”) the target index values are: DJIA = 17 264 (-2,26%) Nikkey-225 = 17 253 (-14,76%) S&P 500 = 1988 (-3,82%) CSI-200 = 4678 (-21,80%) ASX-200 = 4426 (-18,92%) For the target Brent price of $40 and the Gold price of $1336 (“Negative scenario”) the target index values are: DJIA = 15 912 (-9,91%) Nikkey-225 = 14 860 (-26,58%) S&P 500 = 1797 (-13,06%) CSI-200 = 5640 (-5,72%) ASX-200 = 4073 (-25,93%) For the target Brent price of $80 and the Gold price of $1100 (“Positive scenario”) the target index values are: DJIA = 18 011 (1,97%) Nikkey-225 = 18 576 (-8,22%) S&P 500 = 2094 (1,31%) CSI-200 = 4101 (-31,45%) ASX-200 = 4622 (-15,33%) (click to enlarge) Conclusions: Commodities, especially gold and Brent, strongly correlate with the stock indexes ; According to the target Brent price of $65 and the gold price of $1184 (“Basic scenario”), all the remaining indexes tend to fall in price; If Brent is $40 and the gold price is $1336 (“Negative scenario”), most American indexes will dramatically decline in price. Nikkey-225 will fall for more than 25%. In spite of the fact, that low oil price is favorable for China, CSI-200 will fall by 5,72%; The “Positive scenario”, which main assumptions are $80 for Brent and $1100 for gold, provides a small opportunity for DJIA and S&P 500 to rise. But CSI-200 can terribly go down in price for more than 36%; My opinion In fact, the correlation relationships can change during the time, that’s why there is a probability that these models so not work. But my advice is to be careful in long positions with all of these indexes, especially for CSI-200 and Nikkey-225, which seem to be overbought. Technical information The time frame for the investigation was chosen as from 08/01/2011 to 06/01/2015 monthly, or 47 points. The main reason for such a frame was the lack of data, but according to the central limit theorem, the time frame is quite enough to determine the tendency, using correlation and regression analysis tools. All the data was given at the beginning of the month. If there were no trades at the 1st day of the month, the data was taken for the 2nd or the 3rd day. The correlation and regression analysis metrics were measured using Excel Add-ins. Disclosure: I/we have no positions in any stocks mentioned, and no plans to initiate any positions within the next 72 hours. (More…) I wrote this article myself, and it expresses my own opinions. I am not receiving compensation for it (other than from Seeking Alpha). I have no business relationship with any company whose stock is mentioned in this article. Additional disclosure: All the provided data can not be properly used for making investment decisions until consultation of the professional.
Risk Factors Drive Lazard’s Systematic Approach To Core Investing

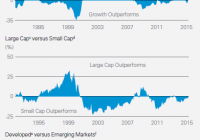
By DailyAlts Staff Core investments are those that anchor the portfolio. Typically, investors pursue exposure to broad-market benchmarks, such as S&P 500 or MSCI indexes for stocks, and the Barclays Aggregate Index for bonds, as part of their core holdings, with the intent of minimizing the unexpected. But rather than passively investing in index funds, Lazard (NYSE: LAZ ) thinks investors should take a systematic approach to implementing core investing strategies, and that is the subject of the firm’s latest Investment Focus white paper: Core Advantage: The Case for a Systematic Approach to Core Investing . The Non-Systematic Approach Managers pursuing non-systematic approaches to providing core exposure suffer from several pitfalls, first among which is the tendency for them to introduce unwanted risks to a portfolio in pursuit of benchmark-beating returns. This can happen from overweighting stocks according to style, market cap, or geographic region. While it might prove rewarding under certain market environments, it can result in outsized losses when trends unexpectedly reverse, and this is not what most investors are looking for from their core holdings. The image below shows how market favor has vacillated over time, shifting between growth and value stocks; large caps and small; and developed and emerging markets: The Systematic Approach The authors of Lazard’s paper believe the systematic approach is the best for core investing, because it allows managers to maintain stricter parameters relative to their benchmark, by ensuring against concentration according to market cap, sector, or country. Additionally, using a rules-based, data-driven, and systematic approach allows managers to analyze hundreds, even thousands of stocks within a given universe, in real-time using a bottom-up process; and to combine “robust risk management” with stock selection. How does it work? Well, according to Lazard, various risk factors have been rewarded by markets over time, including valuation, sentiment, and quality, as depicted in the image below: Valuation compares a company’s price to its peers and its own historical record, and favors companies that are inexpensive and offer long-term value. It’s a contrarian approach, and investors need to be prepared to endure short-term, unrealized losses. Sentiment is gauged by looking at the stock’s price strength, relative to the other stocks in its sector and broader benchmark, as well as analyst upgrades. In Lazard’s approach, liquidity is also taken into account by looking at volume-weighted momentum, and companies with strengthening momentum are favored while those with weakening momentum are disfavored. Quality is assessed by stability of returns and low earnings-volatility. According to Lazard, quality stocks are often those in the process of “migrating” from the realm of growth stocks to that of value. Systematic Evolution Systematic investing avoids concentrating investments in any one area and seeks to maintain a composition similar to that of its benchmark. This requires what Lazard calls an “evolving approach,” wherein investment professionals are constantly researching and testing potential improvements to the investment process. Lazard’s own approach, as implemented by the Lazard Equity Advantage team, is “uniquely positioned to help clients achieve their investment goals,” according to Lazard. “This has proved to be a solid foundation on which to build equity asset class exposure – especially through core approaches – and long-term investment program success.” For more information, download a pdf copy of the white paper .