Tag Archives: most-popular

All That Crap About Not Panicking?

Markets were down on Monday, of course; right now the S&P 500 is at 2057, right around where it started the year. In a way, we have no idea what will happen; and in a way, we know exactly what will happen. More importantly, we know that whenever the market finishes going down, it will then go up and make a new high with the variable being how long it takes. By Roger Nusbaum, AdvisorShares ETF Strategist It is still true. As I write this post Monday after the close, there is still a lot of uncertainty on how Greece will precisely play out. Markets were down on Monday, of course; right now the S&P 500 is at 2057, right around where it started the year and is flirting with its 200 day moving average. We have seen this sort of thing many times before, and after this clears up, there will be other big scary events , a term Ken Fisher has used previously. In a way, we have no idea what will happen; and in a way, we know exactly what will happen. As I write this, again on Monday afternoon, we don’t know when the global selling in equities will end (it might already be over by the time this post is published); we don’t know whether or not China, Puerto Rico or anything else will pile on to send markets lower, even into a bear market (this is not a prediction). This could be serious or it could be one of the many big scary events that are quickly forgotten; we don’t know. We do know that the media will overreact. More importantly, we know that whenever the market finishes going down, it will then go up and make a new high, with the variable being how long it takes. The FTSE 100 recently eclipsed a high dating back to 2000; of course the NASDAQ broke its high from 2000 as well. At some point, the Nikkei will break the high from 1989, but again, no one knows when. There are different implications for different types of market participants, but they all revolve around the same things; not panicking and sticking to the strategy you thought would be a good idea when things hit the fan as they occasionally do. People in the accumulation phase need to keep accumulating. While the FTSE did just make a new high from 2000, that index has about doubled since 2009, so someone who kept accumulating should have caught most of that up move with the equity portion of their portfolio. People in the withdrawal phase should be prepared to take defensive action if that is the strategy they laid out for themselves ahead of time, or stand pat if that is the strategy they laid out for themselves ahead of time. A defensive strategy, which is what I believe in doing, offers the opportunity to make it a little easier emotionally to ride out large declines (remember, at this point we have no idea whether a large decline is coming) and standing pat (save for rebalancing) relies on remembering ahead of time that large declines will be uncomfortable, but that they end and then markets recover, with the only variable being how long it takes; repeated for emphasis. I realize none of this is new and at a high level this is something everyone knows, but knowing and doing can be two different things. Hopefully, a reminder is useful. Editor’s Note: This article discusses one or more securities that do not trade on a major U.S. exchange. Please be aware of the risks associated with these stocks. Disclosure: I/we have no positions in any stocks mentioned, and no plans to initiate any positions within the next 72 hours. (More…) I wrote this article myself, and it expresses my own opinions. I am not receiving compensation for it. I have no business relationship with any company whose stock is mentioned in this article. Additional disclosure: To the extent that this content includes references to securities, those references do not constitute an offer or solicitation to buy, sell or hold such security. AdvisorShares is a sponsor of actively managed exchange-traded funds (ETFs) and holds positions in all of its ETFs. This document should not be considered investment advice and the information contain within should not be relied upon in assessing whether or not to invest in any products mentioned. Investment in securities carries a high degree of risk which may result in investors losing all of their invested capital. Please keep in mind that a company’s past financial performance, including the performance of its share price, does not guarantee future results. To learn more about the risks with actively managed ETFs visit our website AdvisorShares.com .
Book Review: Quantitative Value

Wesley Gray, manager of the ValueShares US Quantitative Value ETF (BATS: QVAL ), may very well be the most interesting quant you’ll ever meet. Granted, the word “quant” brings to mind an old man in a white lab coat stooped over reams of data, but hear me out. Before getting his PhD in finance from the University of Chicago, Gray did four years of service as an active-duty U.S. Marine Corps ground intelligence officer in Iraq and other posts throughout Asia. Quantitative Value isn’t even his first book. That distinction goes to Embedded: A Marine Corps Adviser Inside the Iraqi Army . It’s hard to imagine the average fund manager crawling through the muck and gathering intelligence in Iraqi Arabic. But that is Dr. Gray, and his work is far from average. Quantitative Value , co-written by Gray and Tobias Carlisle, is a solid piece of research that combines the successful value investing framework of Benjamin Graham and Warren Buffett with the analytical rigor seen in Jim O’Shaughnessy’s What Works on Wall Street and Joel Greenblatt ‘s The Little Book that Beats the Market . In fact, Gray and Carlisle write extensively about Greenblatt’s “Magic Formula” and much of the book is an attempt to build the proverbial better mousetrap. We’ll take a look at some of Gray and Carlisle’s methods and then see how they perform in the real world by tracking the returns of the Quantitative Value ETF. The Quantitative Value screening process for stocks resembles a funnel: Step 1: Avoid Stocks That Can Cause a Permanent Loss of Capital This is a more elegant version of Warren Buffett’s first rule of investing: Don’t lose money. In first screening for risky stocks, Gray and Carlisle use some of the same metrics used by short seller John Del Vecchio to identify short candidates, such as days sales outstanding. They also give special attention to accrual accounting in the hopes of weeding out earnings manipulators and run additional screens for probability of financial distress. By removing the riskiest stocks from the pool at the beginning, Gray and Carlisle are a lot less likely to get sucked into a value trap. Step 2: Find the Cheapest Stocks Gray and Carlisle do extensive back testing on virtually every valuation metric under the sun, including industry standards such as price/earnings (“P/E”), price/sales (“P/S”) and price/book value (“P/B”). In the end, they opt to use the same valuation metric as Greenblatt in his Magic Formula: the Earnings Yield, defined here as earnings before interest and taxes (“EBIT”) divided by enterprise value. For those unfamiliar with the term, “enterprise value” is defined here as market cap (including preferred stock) + value of net debt, or what you might think of as the acquisition price of the company. Gray and Carlisle find that of all the assorted valuation metrics, the Earnings Yield yields the best results. Step 3: Find Highest-Quality Stocks This is another nod to both Buffett and Greenblatt. Buffett has repeated often that it is better to buy a wonderful business at a fair price than a fair business at a wonderful price, and Greenblatt tried to capture this mathematically by screening for companies that generated high returns on capital (“ROC”). Gray and Carlisle take it a step further by using an 8-year ROC figure. And they don’t stop there. Gray and Carlisle run additional screens for profitability and combine the metrics into a Franchise Power score. And taking it yet another step, they combine Franchise Power with Financial Strength to form a composite Quality score. Again, the objective here is to capture mathematically what makes intuitive sense: That companies with wide competitive moats, strong brands and strong balance sheets make superior long-term investments. So, how does the Quantitative Value model actually perform? In back-tested returns, it crushed the market. From 1974 to 2011, Quantitative Value generated compounded annual returns of 17.68% to the S&P 500’s 10.46%. Of course, we should always take back-tested returns with a large grain of salt. For a better comparison, let’s see how the Quantitative Value ETF has performed in the wild. We don’t have a lot of data to work with, as QVAL only started trading in late October 2014. But over its short life, QVAL is modestly beating the S&P 500’s price returns, 9.96% vs. 9.15%. As recently as April, it was beating the S&P 500 by a cumulative 4%. Looking at the returns of a substantially-similar managed account program managed by Gray’s firm, the “real world” results look solid. From November 2012 to May 2015, the Quantitative Value strategy generated compounded annual returns of 21.1% vs. the 18.3% return of the S&P 500. The Quantitative Value strategy was modestly more volatile (beta of 1.2) and had slightly larger maximum drawdowns (-6.0% vs. -4.4%). But this is exactly what you would expect from a concentrated portfolio. I look forward to seeing how QVAL performs over time, and I congratulate Gray and Carlisle on a book well written. Note: When referring to the book, “Quantitative Value” is italicized. When referring to the ETF or to the broader strategy, it is not. Original post Disclaimer: This article is for informational purposes only and should not be considered specific investment advice or as a solicitation to buy or sell any securities. Sizemore Capital personnel and clients will often have an interest in the securities mentioned. There is risk in any investment in traded securities, and all Sizemore Capital investment strategies have the possibility of loss. Past performance is no guarantee of future results.

Dividend Growth Stock Overview: Middlesex Water Company

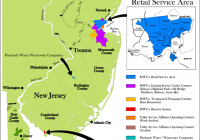
Summary MSEX provides water and wastewater services to about 450,000 people across New Jersey, Delaware and Pennsylvania. The company has paid dividends since 1912 and increased them since 1973. MSEX has compounded dividends at less than 1.5% for the last decade and less than 2% for the last quarter century. About Middlesex Water Company Middlesex Water Company (NASDAQ: MSEX ) provides water and wastewater services to over 450,000 people across parts of New Jersey, Delaware and Pennsylvania. The company began operating water utility services in New Jersey in 1897, and recently expanded to Delaware in 1992 and Pennsylvania in 2009. The company also received approval to operate in Maryland in 2007, but does not have any business there. Image from Middlesex Water Company’s website . Middlesex Water divides its operations into two business segments – regulated and unregulated. Like most utilities, the company receives most of its revenue and income from its regulated business, providing an average of 88% and 93% of revenues and income from 2012-2014. In 2014, Middlesex’s regulated businesses had revenues of $103.3 million, up 2.6% from 2013, and net income of $17.3 million, up 11.6%. The increase in revenues was due to higher customer demand and rate increases from regulatory agencies. The large net income increase was due to lower expenses from improved performance in the company’s pension plan and fewer water main breaks as compared to 2013. The unregulated business segment – covering Middlesex’s service in Perth Amboy, NJ; Avalon, NJ; and portions of Delaware – had net income of $1.2 million on revenues of $13.8 million, up 9.1% and down 2.1%, respectively. In 2014, Middlesex Water had total revenues of $117.1 million, of which nearly half came from residential customers. The company’s net income was up nearly 11% year-over-year to $18.4 million and EPS were up 9.7% to $1.13. With the annualized dividend payment of 77 cents per share, Middlesex Water has a payout ratio of about 68%. The company trades under the ticker symbol MSEX. Middlesex Water Company’s Dividend and Stock Split History Middlesex Water has grown dividends incredibly slowly – less than 1.5% a year for the last decade. Middlesex Water has paid dividends continuously since 1912 and increased them annually since 1973. The company pays out its quarterly dividends at the beginning of March, June, September, and December. Annual dividend increases are announced around the 20th of October, with the stock going ex-dividend in mid-November. Last November, Middlesex Water announced a 1.3% increase in the quarterly dividend to an annualized payment of 77 cents per share. Middlesex Water should announce its 43rd annual dividend increase in October 2015. Middlesex Water has built a record of steady, but very slow dividend growth. Since 2004, the company has increased its annual dividend by a penny a year, resulting in 5- and 10-year compounded annual dividend growth rates (CADGRs) of 1.4%. Longer term, the dividend growth record is not much better; the 20-year and 25-year CADGRs are 1.9% and 2.0%, respectively. The company has split its stock 4 times since beginning its record of annual dividend growth. 2-for-1 splits occurred in December 1984 and September 1992; a 3-for-2 split occurred in January 2002; and a 4-for-3 split occurred in November 2003. Prior to 1973, Middlesex Water split its stock 5-for-1 in October 1927; 3-for-2 in October 1959; and 2-for-1 in December 1967. A single share of Middlesex Water’s stock purchased in 1973 would have split into 8 shares. Over the 5 years ending on December 31, 2014, Middlesex Water’s stock appreciated at an annualized rate of 9.52%, from a split-adjusted $14.39 to $22.67. This underperformed the 13.0% annualized return of the S&P 500 during this time. Middlesex Water Company’s Direct Purchase and Dividend Reinvestment Plans Middlesex Water Company has both direct purchase and dividend reinvestment plans. You do not need to be a current investor to participate. New investors must purchase at least $500 of Middlesex Water’s stock and are required to reinvest dividends on at least 10 shares of stock. Subsequent purchases of stock must be at least $25. The fee structure of the plan is favorable for investors, with the company picking up all fees on stock purchases. When you sell your shares, you’ll pay a sales commission of $15 plus associated brokerage fees. All fees are deducted from the sales proceeds. Helpful Links Middlesex Water Company’s Investor Relations Website Current quote and financial summary for Middlesex Water Company (finviz.com) Information on the direct purchase and dividend reinvestment plans for Middlesex Water Disclosure: I/we have no positions in any stocks mentioned, and no plans to initiate any positions within the next 72 hours. (More…) I wrote this article myself, and it expresses my own opinions. I am not receiving compensation for it. I have no business relationship with any company whose stock is mentioned in this article.