Tag Archives: most-popular

Rising Rates Are Good For PHK, Part II

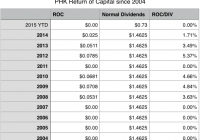
Summary PHK pays out 19.2% of its NAV in dividends to shareholders. This distribution is unsustainable, as the fund’s managers have increasingly relied on active investment in bonds, currencies, and derivatives to sustain payouts with minimal return of capital, thus increasing risk. If interest rates rise, PHK is likely to become less reliant on this riskier approach as its NII will increase. The greatest concern regarding Pimco High Income Fund (NYSE: PHK ) is its payout to NAV ratio. With NAV of $7.62 as of July 2nd and annual dividend payouts of $1.46256, the fund needs to get a 19.2% return to sustain its dividend. Bears argue that this is impossible, and that the fund has to return capital and deplete its NAV to maintain the unsustainable dividend. However, according to CEF Connect , PHK has not paid a Return of Capital in over a year. On top of that, PHK’s history of funding distributions through ROC is moderate. While 1.71% of distributions came from ROC last year, that is down from the prior two years: Also significant: the fund has not resorted to ROC to fund distributions in years of rising rates — years of ROC distributions coincide with times of heightened economic crisis (2008, 2009, 2010) for the most part, although the reliance of ROC during 2012, 2013, and 2014 indicates the fund has had some difficulty in covering distributions from income along. However, the consistent decline in ROC and the absence of ROC so far for 2015 suggests that the fund has been able to wean itself off this stop-gap. There is still a fear that the fund will need to resort to ROC soon, since the average coupon of the fund, according to its most recent holdings report , is 5.165%. Even with leverage, which has fallen to 29% in recent months, it seems there is no way the fund can return 19%. So how can PHK continue to cover dividends when it is paying out 19% on NAV? Clipping Coupons To understand this, we first need to take a step back and remind ourselves that the income a bond holder receives is not necessarily the same as the coupon rate. Bonds are frequently bought at a discount, particularly by institutional investors who have greater access to a market that is much less liquid than equities. Since PHK does not reveal the price it has paid for its holdings, and we can only infer how long it keeps certain holdings in its portfolio, coupon rates are useless in determining the sustainability of the dividend or the fund’s ability to earn a 19% return on NAV. Additionally, the fund’s use of derivatives, its arbitrage and hedging from shorting, and its currency trades make it impossible to know exactly how well operations can fund distributions to shareholders. A better way to understand the return it is getting from its portfolio is to compare its net investment income to its NAV. If we look at these, we see that the fund is now earning about a 12.4% return: This is nowhere near the 19% return that is necessary to sustain the dividend in perpetuity, but is much better than the coupon rates suggest. However, this might become the wrong way to look at this fund if rates rise sufficiently. A Better Investment on Rising Rates While it is undeniable that the low interest rate environment hurts PHK’s NII and its ability to sustain its dividend, the sustainability of those payouts improves considerably in times of higher rates, as the above chart suggests. NII has fallen 43% from 2006 to 2015 due to lower interest rates, and its NII is likely to rise if rates rise and the fund is able to purchase discounted issues with a higher coupon rate. The fund’s recent decline in leverage might indicate its managers are anticipating a rise in rates and are positioning themselves accordingly by freeing up access to capital. Much more crucially: a rise in rates will also help the fund cover dividends, as its NII-to-Dividend Ratio remained well over 100% until the Global Financial Crisis in 2008: Surprisingly, the fund’s NII-to-Dividend ratio remained strong in 2009, when its NAV plummeted to less than $3 at its lowest point. At that time, and for several years since then, the fund has been able to more than cover dividends through investment operations — the kind of arbitrage, churn, and derivative trading that investors pay for. (The significant exception, in 2012, was during Bill Gross’s tenure as manager of the fund. He is no longer with the fund or PIMCO.) The fact that the fund has relied on this kind of active speculation more than before 2008 suggests that there is considerably greater risk in the fund than there was then, but it may also suggest that the fund will become less reliant on such tactics when rates rise. While it is true that the total capital PHK has to invest is much less than in 2005-2008, making it a riskier investment than it was then, its access to higher-yielding bond opportunities in a rising rate environment may make it a less risky investment than it has been since 2008 and throughout the 7 years that the fund maintained its monthly dividend payouts. Conclusion PHK is not without its risks. Its reliance on derivatives and investment operations, particularly since 2009, means greater volatility in dividend coverage and a greater risk in a decline in NAV, as we have seen in four of the last 8 years since the Global Financial Crisis, including this year. At the same time, the fund’s ability to earn higher rates of income in periods of rising rates means that a sell-off due to rising rates is unwarranted. Most significantly, if rates do rise later this year or next year, PHK may find it easier to earn income from the high yield market and become less reliant on derivatives and active trading to boost returns. Disclosure: I am/we are long PHK. (More…) I wrote this article myself, and it expresses my own opinions. I am not receiving compensation for it (other than from Seeking Alpha). I have no business relationship with any company whose stock is mentioned in this article.
How To Find The Best Style ETFs: Q2’15 In Review

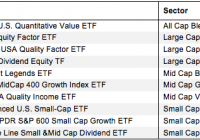
Summary The large number of ETFs hurts investors more than it helps as too many options become paralyzing. Performance of an ETFs holdings are equal to the performance of an ETF. Our coverage of ETFs leverages the diligence we do on each stock by rating ETFs based on the aggregated ratings of their holdings. Finding the best ETFs is an increasingly difficult task in a world with so many to choose from. How can you pick with so many choices available? Don’t Trust ETF Labels There are at least 65 different All Cap Blend ETFs and at least 289 ETFs across twelve styles. Do investors need 20+ choices on average per style? How different can the ETFs be? Those 65 All Cap Blend ETFs are very different. With anywhere from 4 to 3775 holdings, many of these All Cap Blend ETFs have drastically different portfolios, creating drastically different investment implications. The same is true for the ETFs in any other style, as each offers a very different mix of good and bad stocks. Large Cap Value ranks first for stock selection. Small Cap Blend ranks last. Details on the Best & Worst ETFs in each style are here . A Recipe for Paralysis By Analysis We firmly believe ETFs for a given style should not all be that different. We think the large number of All Cap Blend (or any other) style ETFs hurts investors more than it helps because too many options can be paralyzing. It is simply not possible for the majority of investors to properly assess the quality of so many ETFs. Analyzing ETFs, done with the proper diligence, is far more difficult than analyzing stocks because it means analyzing all the stocks within each ETF. As stated above, that can be as many as 3775 stocks, and sometimes even more, for one ETF. Any investor worth his salt recognizes that analyzing the holdings of an ETF is critical to finding the best ETF. Figure 1 shows our top rated ETF for each style. Note there are no ETFs currently under coverage in the All Cap Growth or All Cap Value Styles. Figure 1: The Best ETF in Each Style Sources: New Constructs, LLC and company filings How to Avoid “The Danger Within” Why do you need to know the holdings of ETFs before you buy? You need to be sure you do not buy an ETF that might blow up. Buying an ETF without analyzing its holdings is like buying a stock without analyzing its business and finances. No matter how cheap, if it holds bad stocks, the ETF’s performance will be bad. PERFORMANCE OF ETF’S HOLDINGS = PERFORMANCE OF ETF If Only Investors Could Find Funds Rated by Their Holdings The Arrow QVM Equity Factor ETF (NYSEARCA: QVM ) is the top-rated Large Cap Blend ETF and the overall best ETF of the 289 style ETFs that we cover. The worst ETF in Figure 1 is the SPDR S&P 600 Small Cap Growth ETF (NYSEARCA: SLYG ), which gets our Neutral rating. One would think ETF providers could do better for this style. Disclosure: David Trainer and Max Lee receive no compensation to write about any specific stock, style, or theme. Disclosure: I/we have no positions in any stocks mentioned, and no plans to initiate any positions within the next 72 hours. (More…) I wrote this article myself, and it expresses my own opinions. I am not receiving compensation for it. I have no business relationship with any company whose stock is mentioned in this article.
IJR’s 2015 2nd-Quarter Performance And Seasonality

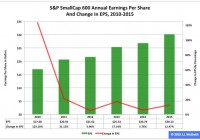
Summary The iShares Core S&P Small-Cap ETF in the first half ranked No. 2 among the three most popular exchange-traded funds based on the S&P Composite 1500’s constituent indexes. In the second quarter, the ETF’s adjusted closing daily share price climbed 0.17 percent. And in June, the fund’s share price rose 1.06 percent. The iShares Core S&P Small-Cap ETF (NYSEARCA: IJR ) during 2015’s first half was second by return among the three most popular ETFs based on the S&P Composite 1500’s constituent indexes: It advanced to $117.88 from $113.33, a gain of $4.55, or 4.02 percent. Over the same period, IJR performed worse than the SPDR S&P MidCap 400 ETF (NYSEARCA: MDY ) by -0.06 percentage point and better than the SPDR S&P 500 ETF (NYSEARCA: SPY ) by 2.91 percentage points. IJR last quarter lagged SPY by -0.06 percentage point and led MDY by 1.29 percentage points. And most recently, IJR last month outpaced MDY and SPY by 2.34 and 3.07 percentage points, respectively. Comparisons of changes by percentages in SPY, MDY, IJR, the small-capitalization iShares Russell 2000 ETF (NYSEARCA: IWM ) and the large-cap PowerShares QQQ (NASDAQ: QQQ ) during the first half, over Q2 and in June can be found in charts published in “SPY’s 2015 2nd-Quarter Performance And Seasonality.” Figure 1: S&P 600 EPS , 2010-2014 Actual And 2015 Projected (click to enlarge) Notes: (1) Estimates are employed for the 2015 data. (2) The EPS scale is on the left, and the change-in-EPS scale is on the right. Source: This J.J.’s Risky Business chart is based on analyses of data in the S&P 500 Earnings and Estimate Report released June 30. IJR may have done OK in the first half, but the ETF might have a hard time doing OK in the second half, with the analysts’ average 2015 earnings-per-share estimate for the S&P 600 index underlying the fund sliding to $30.13 June 30 from $33.60 March 31, as indicated by Howard Silverblatt, senior index analyst at S&P Dow Jones Indices, in the S&P 500 Earnings and Estimate Report series this year (Figure 1). I believe this EPS estimate continues to be unrealistic, as it would require growth of 12.47 percent over last year, so I think there will be more downward revisions in this estimate, which collectively will not constitute an IJR tailwind. In an attempt to put the S&P 600’s valuation in perspective, I calculated the index’s price-to-earnings ratio a couple of different ways based on its closing level of 717.55 Thursday. First I employed its actual EPS of $26.79 in 2014 to produce a P/E ratio of 26.78, and then I used its estimated EPS of $30.13 in 2015 to produce a P/E ratio of 23.82. Because I am a growth-and-value guy who does not anticipate a whole lot of earnings growth this year, I am underwhelmed by this overvaluation, especially at a time when the U.S. Federal Reserve is not expanding its balance sheet by making asset purchases under a quantitative-easing program. Figure 2: IJR Monthly Change, 2015 Vs. 2001-2014 Mean (click to enlarge) Source: This J.J.’s Risky Business chart is based on analyses of adjusted closing monthly share prices at Yahoo Finance . IJR behaved a lot worse in the first half of this year than it did during the comparable periods in its initial 14 full years of existence based on the monthly means calculated by employing data associated with that historical time frame (Figure 2). The same data set shows the average year’s weakest quarter was the third, with a relatively small negative return, and its strongest quarter was the fourth, with an absolutely large positive return. Figure 3: IJR Monthly Change, 2015 Vs. 2001-2014 Median (click to enlarge) Source: This J.J.’s Risky Business chart is based on analyses of adjusted closing monthly share prices at Yahoo Finance. IJR also performed a lot worse in the first half of this year than it did during the comparable periods in its initial 14 full years of existence based on the monthly medians calculated by using data associated with that historical time frame (Figure 3). The same data set shows the average year’s weakest quarter was the third, with a relatively small positive return, and its strongest quarter was the fourth, with an absolutely large positive return. Disclaimer: The opinions expressed herein by the author do not constitute an investment recommendation, and they are unsuitable for employment in the making of investment decisions. The opinions expressed herein address only certain aspects of potential investment in any securities and cannot substitute for comprehensive investment analysis. The opinions expressed herein are based on an incomplete set of information, illustrative in nature, and limited in scope. In addition, the opinions expressed herein reflect the author’s best judgment as of the date of publication, and they are subject to change without notice. Disclosure: I/we have no positions in any stocks mentioned, and no plans to initiate any positions within the next 72 hours. (More…) I wrote this article myself, and it expresses my own opinions. I am not receiving compensation for it (other than from Seeking Alpha). I have no business relationship with any company whose stock is mentioned in this article.