Tag Archives: most-popular

How To Avoid The Worst Sector ETFs: Q2’15 In Review

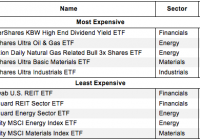
Summary The large number of ETFs has little to do with serving your best interests. Below are three red flags you can use to avoid the worst ETFs. The following presents the least and most expensive sector ETFs as well as the worst overall sector ETFs per our 2Q15 sector ratings. Question: Why are there so many ETFs? Answer: ETF providers tend to make lots of money on each ETF so they create more products to sell. The large number of ETFs has little to do with serving your best interests. Below are three red flags you can use to avoid the worst ETFs: 1. Inadequate Liquidity This issue is the easiest to avoid, and our advice is simple. Avoid all ETFs with less than $100 million in assets. Low levels of liquidity can lead to a discrepancy between the price of the ETF and the underlying value of the securities it holds. Plus, low asset levels tend to mean lower volume in the ETF and larger bid-ask spreads. 2. High Fees ETFs should be cheap, but not all of them are. The first step here is to know what is cheap and expensive. To ensure you are paying at or below average fees, invest only in ETFs with total annual costs below 0.54%, which is the average total annual cost of the 187 U.S. equity Sector ETFs we cover. Figure 1 shows the most and least expensive Sector ETFs. ProShares provides three of the most expensive ETFs while Vanguard ETFs are among the cheapest. Sources: New Constructs, LLC and company filings Investors need not pay high fees for quality holdings. The Consumer Staples Select Sector SPDR ETF (NYSEARCA: XLP ) earns our Very Attractive rating and has low total annual costs of only 0.17%. On the other hand, the Schwab U.S. REIT ETF (NYSEARCA: SCHH ) holds poor stocks. No matter how cheap an ETF, if it holds bad stocks, its performance will be bad. The quality of an ETF’s holdings matters more than its price. 3. Poor Holdings Avoiding poor holdings is by far the hardest part of avoiding bad ETFs, but it is also the most important because an ETF’s performance is determined more by its holdings than its costs. Figure 2 shows the ETFs within each sector with the worst holdings or portfolio management ratings . Figure 2: Sector ETFs with the Worst Holdings Sources: New Constructs, LLC and company filings PowerShares appears more often than any other providers in Figure 2, which means that they offer the most ETFs with the worst holdings. Our overall ratings on ETFs are based primarily on our stock ratings of their holdings. The Danger Within Buying an ETF without analyzing its holdings is like buying a stock without analyzing its business and finances. Put another way, research on ETF holdings is necessary due diligence because an ETF’s performance is only as good as its holdings’ performance. PERFORMANCE OF ETF’s HOLDINGS = PERFORMANCE OF ETF Disclosure: David Trainer and Max Lee receive no compensation to write about any specific stock, sector, or theme. Disclosure: I/we have no positions in any stocks mentioned, and no plans to initiate any positions within the next 72 hours. (More…) I wrote this article myself, and it expresses my own opinions. I am not receiving compensation for it. I have no business relationship with any company whose stock is mentioned in this article.
The Second Cyber Security ETF Has Arrived

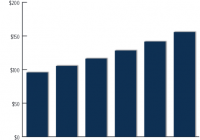
Summary Cyber security stocks have been a popular technology play this year. First Trust comes out with new cyber security ETF, the second offering in the space. Focus on the First Trust NASDAQ CEA Cybersecurity ETF. By Todd Shriber & Tom Lydon Confirming that cyber security is one of this year’s hottest investment themes, First Trust, the sixth-largest U.S. issuer of exchange traded funds, introduced on July 7th, the First Trust NASDAQ CEA Cybersecurity ETF (NasdaqGM: CIBR ) , the second cyber security ETF to come to market since November. The first is the well-entrenched, fast-growing PureFunds ISE Cyber Security ETF (NYSEArca: HACK ) , an ETF that needed less than eight months of trading to eclipse $1 billion in assets under management. HACK, the household name among cyber security ETFs, entered trading Tuesday with nearly $1.2 billion in assets under management . CIBR will track the Nasdaq CEA Cybersecurity Index, which “is designed to track the performance of companies engaged in the cybersecurity segment of the technology and industrials sectors. It includes companies primarily involved in the building, implementation, and management of security protocols applied to private and public networks, computers, and mobile devices in order to provide protection of the integrity of data and network operations,” according to a statement issued by First Trust. Amid a spate of public and private sector data breaches, the most recent afflicting personal data of federal employees, cyber security stocks are getting increased attention and, more importantly, are surging. Although it has given back some gains in recent weeks, HACK is up 12.4% year-to-date, more than triple the 3.9% gained by the Nasdaq Composite. “Cybersecurity is gaining global attention following recent high profile security breaches,” notes First Trust . “The opportunity for cybercrime is expected to grow and may cost the global economy as much as $575 billion annually. As cybercrimes continue to increase, the global cybersecurity market is forecast to grow at a compound annual growth rate (CAGR) of 10.3% from $95.6 billion in 2014 to $155.74 billion in 2019.” CIBR’s underlying index, which began trading on June 23, is home to 34 companies, including AhnLab, Akamai (NASDAQGS: AKAM ), Check Point Software (NASDAQGS: CHKP ), Cisco Systems (NASDAQGS: CSCO ), CyberArk (NASDAQGS: CYBR ) and FireEye (NASDAQGS: FEYE ), according to Nasdaq data . Companies must have a minimum market value of $250 million, a minimum three-month daily dollar trading volume of $1 million and a minimum free float of 20% to be eligible for the index. CIBR and HACK may not be alone in the cyber security ETF space for long as Direxion has plans to introduce leveraged bearish and bullish versions of HACK . Cyber Security Estimated Spending Growth Chart Courtesy: First Trust Disclosure: I/we have no positions in any stocks mentioned, and no plans to initiate any positions within the next 72 hours. (More…) I wrote this article myself, and it expresses my own opinions. I am not receiving compensation for it. I have no business relationship with any company whose stock is mentioned in this article.

While The Athens Exchange Is Closed, The Greece ETF Show Goes On

Investors can still trade Greece through an ETF while Athens Stock Exchange was closed. GREK showing larger discount to net asset value. Investors should understand risks of ETFs that track international markets. Exchange traded funds try to reflect the performance of an underlying market. However, there are times when an ETF may diverge from the net asset value, especially with international markets. For example, the Global X FTSE Greece 20 ETF (NYSEArca: GREK ) is was trading at a 10.4% discount to its NAV on Monday, according to Morningstar data. GREK plunged 8.9% Monday on over four times its average daily volume after Greece rejected austerity measures demanded by international creditors in a referendum vote over the weekend. The Greece ETF has been swinging in volatile trading over the past week . ETFs, more or less, consistently reflect the movement of their net asset value, or combined value of all securities in an ETF’s portfolio divided by the number of ETF shares outstanding, as market makers or authorized participants create or redeem ETF shares by buying or selling baskets of underlying securities for ETFs. Since ETFs trade like any other stock on an exchange, the ETF’s price can fluctuate throughout the day. ETFs typically update their underlying trading value, calculating the approximate NAV every 15 seconds throughout the trading day. In domestic equity ETFs, the NAV works as intended. The NAV provides a fair value of the ETF, which basically means the fund is trading in line with its underlying assets with little or no tracking error. This also allows investors to get a better view of whether or not they are over or underpaying an ETF. When the ETF’s price is lower than the NAV , the ETF is said to be at a “discount” – the ETF is valued less than the fund’s overall holdings. If the ETF’s price is above the NAV, the ETF is said to trade at a “premium” – the ETF is trading higher than what the underlying holdings are worth. However, the NAV gets cloudier when looking into other markets. For instance, international markets are not open in the same time zone as U.S. markets, but foreign stock and bond ETFs are still trading on U.S. exchanges. Since the NAV is taken based on the last price at which it was traded, the NAV may not move during normal hours. Consequently, the NAV for international ETFs, along with most commodity and fixed-income funds, may represent a stale number as these markets don’t necessarily trade during normal U.S. market hours. In the case of Greece, the Athens Stock Exchange has been closed for at least a week, following the June 28 decision by the Systemic Stability Council for a week-long closure of the country’s banks and local stock market, according to ekathimerini . The Greek bourse remains closed Monday. Consequently, the traded value of GREK has deviated considerably from its NAV – the ETF is currently trading at a much lower value to its constituents due to the underlying market closure. The last time something similar occurred was during the so-called Arab Spring of 2011 when Egyptian markets were shut down for two months, but U.S. investors were still able to trade shares of the Market Vectors Egypt Index ETF (NYSEArca: EGPT ) . Nevertheless, GREK ETF investors may still get a general sense of where the ETF is going through indirect means. For instance, Coca-Cola HBC, which makes up 21.4% of GREK, dipped 3.9% over the past week while the National Bank of Greece (NYSE: NBG ), which makes up 9.5% of GREK, saw the value of its American Depository Receipts pare recent gains to fall flat for the week. Max Chen contributed to this article . Disclosure: I/we have no positions in any stocks mentioned, and no plans to initiate any positions within the next 72 hours. (More…) I wrote this article myself, and it expresses my own opinions. I am not receiving compensation for it. I have no business relationship with any company whose stock is mentioned in this article.