Tag Archives: most-popular

5 Questions On Risk In Concentrated Equities Today

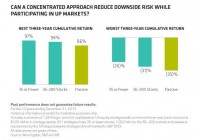
By Mark Phelps & Dev Chakrabarti As equity markets cope with fresh volatility from China to Europe, managing risk is a top priority. In our view, concentrated portfolios stand up to scrutiny on risk – even in today’s complex market conditions. Concentrated portfolios are a popular way to capture high conviction in equities. But many investors worry that by focusing on a small number of stocks, they may be more vulnerable when volatility strikes. These five questions can help gauge whether that’s really true. 1. Is a concentrated equity portfolio more vulnerable to a market correction than a diversified portfolio? Not necessarily. Based on our experience – and academic studies – we believe that concentrated portfolios can actually cushion the damage in a market correction. Since concentrated managers have much more to lose than managers of diversified portfolios if a single stock underperforms, they tend to be much more focused on the earnings risk of individual holdings and of the portfolio. Our research on US equity strategies supports this notion. We followed up on the famous study by Cremers and Petajisto* and found that the median concentrated US equity manager, with 35 or fewer stocks in a portfolio, incurred less severe losses than diversified portfolios in down markets. This made it easier to recoup losses on the way back up. As a result, concentrated strategies posted stronger three-year returns than traditional active and passive strategies over the 10-year period studied (Display). And during the worst three-year period, the portfolios of concentrated managers declined less than other active and passive portfolios. 2. Why isn’t a concentrated portfolio more vulnerable to market surprises? Portfolios with small numbers of stocks by definition have a high active share and diverge from the benchmark substantially. This can be a good thing when surprises rattle the market. Benchmarks give investors exposure to volatile sectors, especially in down markets. For example, both energy and financials are sectors that are notoriously unstable. So constructing a portfolio that is less exposed to those sectors would tend to protect against vulnerability in those markets. In the oil-price shock of the last year, a diversified portfolio with weights that are closer to the benchmark is more likely to have greater exposure to the energy sector than a concentrated portfolio. And in financials, many pure banks are too risky for a concentrated portfolio, in our view, because it’s simply too difficult to forecast earnings that are tied to the uncertainties of the future rate environment. 3. Does that mean a concentrated portfolio will miss out on a big sector recovery? It’s true that volatile sectors do lead the market at times. But over the long term, we believe it’s better to focus on a few select holdings that provide alternative ways to gain selective exposure to a sector recovery. For example, some financial exchanges or asset management firms have much lower capital intensity than pure banks – and offer better return potential driven by secular trends in their industries, in our view. Focusing on stocks that have shown consistency of earnings through good and bad periods is a more prudent path to generating long-term returns than taking big sector overweights, which may be prone to instability. 4. How can regional risk be managed in a global portfolio with so few stocks? While concentrated managers always focus primarily on stock-specific issues, monitoring regional exposure is important. Stock-picking decisions must also ensure that the sum of a global portfolio’s parts is balanced and appropriately positioned for macroeconomic conditions. Today, the US is enjoying a relatively strong demand environment while coping with the effects of a stronger dollar on exports. Conversely, Japan is deliberately weakening its currency in an effort to kick-start the economy and spur wage inflation. A concentrated portfolio can reflect these trends by focusing only on those US companies exposed to a consumer recovery with solid revenue growth and Japanese exporters that are putting their cash to work for shareholders. This can help create a natural currency hedge – without using derivatives or shorting. And when currencies shift, a concentrated portfolio can take advantage of changing dynamics by tilting a portfolio with a few strategic changes instead of turning over large numbers of holdings. 5. What’s the biggest risk to a concentrated portfolio today? Turmoil in the Chinese markets along with the recent escalation of the Greek debt crisis and the potential for contagion across Europe are, of course, the most significant risks for any global equity manager today. However, we think one of the largest challenges for concentrated allocations today, is how to incorporate downside protection, given the market moves earlier in the year. Defensive segments of global equity markets, such as consumer-staples and income stocks, are expensive. So they may not be as effective in protecting performance during a down market. In concentrated portfolios, where a small number of defensive companies play a vital role in risk management, this could erode the buffers against volatility. Identifying defensive growth companies can help resolve this problem. For example, business services or companies supplying consumer staples have more attractive valuations and can deliver long-term growth – and downside protection, in our view. Similarly, we’d prefer stocks with stable and consistent growth that have attractive policies on returning cash to shareholders as an added feature over pricey stocks that offer income as a primary feature. *Cremers, K.J. Martijn and Petajisto, Antti. “How Active Is Your Fund Manager? A New Measure That Predicts Performance,” March 31, 2009 The views expressed herein do not constitute research, investment advice or trade recommendations and do not necessarily represent the views of all AB portfolio-management teams. AllianceBernstein Limited is authorized and regulated by the Financial Conduct Authority in the United Kingdom.
With High-Yield ETFs, Costs Can Be Hidden

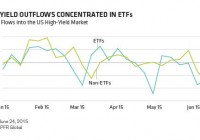
By Gershon Distenfeld More and more investors see exchange-traded funds (ETFs) as an easy and inexpensive way to tap into the high-yield market. We have some friendly advice for them: look again. Financial advisors who use ETFs as core holdings in their clients’ portfolios-and even some institutional investors-often tell us they like them for two big reasons. First, ETFs passively track an index, which means they’re cheaper than actively managed funds. Second, they’re liquid. Unlike mutual funds, which are priced just once a day, ETFs can be bought and sold at any time, just like stocks. But when it comes to high yield, ETFs aren’t really that cheap or that liquid. Look for the Hidden Costs Let’s start with costs. Sure, some ETF management fees are quite a bit lower than mutual fund fees-but that mostly goes for ETFs that invest in highly liquid assets such as equities. In a less liquid market, like high yield, expense ratios can be as high as 40 or 50 basis points-not that much lower than many actively managed mutual funds. It’s also easy to overlook some of the hidden costs. For instance, anyone who wants to buy or sell an ETF must pay a bid-ask spread, the difference between the highest price that buyers are willing to offer and the lowest that sellers are willing to accept. That spread might be narrow for small amounts but wider for larger blocks of shares. And when market volatility rises, bid-ask spreads usually widen across the board. And ETF managers can rack up trading costs even when market volatility is low. This is partly because bonds go into and out of the high-yield benchmarks often-certainly more often than stocks enter and exit the S&P 500 Index. To keep up, ETF managers have to trade the bonds that make up the index more often. Frequent trading can also cause ETF shares to trade at a premium or discount to the calculated net asset value. In theory, this situation shouldn’t last long. If an ETF’s market price exceeds the value of its underlying assets, investors should be able to sell shares in the fund and buy the cheaper underlying bonds. But the US high-yield market has more than 1,000 issuers and even more securities, and it can be difficult for investors to get their hands on specific bonds at short notice. That means investors often end up overpaying. This can work the other way around, too. If something happens to make investors want to cut their high-yield exposure, the easiest way to do that is to sell an ETF. That can push ETF prices down more quickly than the prices of the bonds they invest in, adding to ETF investors’ losses. We saw this in May and June, when worries about higher interest rates rattled fixed-income investors. Outflows from high-yield ETFs outpaced those from the broader high-yield market ( Display ). Are Passive ETFs Really Passive? Investors might also want to consider whether high-yield ETFs are truly passive. For example, the manager of an S&P 500 equity ETF can easily buy all the stocks that make up the index. But as we’ve seen, that isn’t so easy in high yield-the market isn’t as liquid. ETF managers compensate for this by using sampling techniques to help them decide which securities to buy. Can a fund that requires active decision making and frequent trading be considered passive? We think that’s a fair question. Not as Deep as You Think Here’s another question worth asking: just how liquid are ETFs? Those who look closely may find that the pool isn’t quite as deep as they thought. Why? The growing popularity of ETFs means they have to hold an ever larger share of less liquid assets. If the underlying asset prices were to fall sharply, finding buyers might be a challenge, and investors who have to sell may take a sizable loss. Does this mean ETFs have no place in an investment portfolio? Of course not. We think that a well-diversified portfolio may well include a mix of actively managed funds and ETFs-provided that the ETFs are genuinely low cost and passive. We just don’t think those attributes apply to high-yield ETFs. And we suspect that investors who decide to use them as a replacement for active high-yield funds will come to regret it. The views expressed herein do not constitute research, investment advice or trade recommendations and do not necessarily represent the views of all AB portfolio-management teams.

Q2 2015 U.S. Equity Fund Performance Summary

By Tom Roseen Despite hitting multiple record highs and triple-digit lows over the three months, the markets were generally in a sideways pattern during second quarter 2015. While the Russell 2000 and the NASDAQ Composite managed to break into record territory in mid-June, advances to new highs were generally just at the margin. However, at June month-end concerns about the Greek debt drama, looming U.S. interest rate increases, Puerto Rico’s inability to service its public debt, and China’s recent market crash weighed heavily on investors. A positive finish for equities on the last trading day of June wasn’t enough to offset the Greek debt-inspired meltdown from the prior day, and many of the major indices witnessed their first quarterly loss in ten, with the Dow Jones Industrial Average and the S&P 500 losing 0.88% and 0.23%, respectively, for Q2, while the NASDAQ Composite gained 1.75%. However, the average equity fund (+0.09%) just managed to stay in the black for Q2, stretching the winning streak to three quarters in a row. For the quarter only 43 of Lipper’s 96 equity and mixed-equity fund classifications posted positive returns. For the second consecutive quarter Lipper’s World Equity Funds macro-classification (+1.22%) was at the top of the leader board, outpacing the other three broad equity groupings. USDE Funds (+0.03%) took the runner-up position for the quarter, followed by Mixed-Asset Funds (-0.66%) and Sector Equity Funds (-1.80%). In total, only 48% of all individual equity and mixed-asset funds posted plus-side returns for the quarter. Lipper’s preliminary Q2 2015 fund-flows numbers showed mutual fund investors were net redeemers of fund assets for the quarter, withdrawing an estimated $35.7 billion from the conventional funds business (excluding exchange-traded funds [ETFs]). During the quarter investors were net redeemers of money market funds (-$47.1 billion), equity funds (-$5.5 billion), and municipal bond funds (-$1.7 billion), but they were net purchasers of taxable fixed income funds (+$18.6 billion). In line with Q1 2015 and despite increasing geopolitical concerns, for Q2 U.S. fund investors favored nondomestic equity funds over domestic equity funds, injecting $34.5 billion versus withdrawing $40.0 billion, respectively. Nevertheless, conventional fund investors continued to show a clear preference for developed-market funds (+$33.9 billion) over emerging-market funds (+$3.4 billion) during the quarter. ETF investors (authorized participants) were net purchasers for Q2 2015, injecting $29.9 billion into equity ETFs while also being net purchasers of taxable fixed income ETFs (+$1.7 billion) and municipal debt ETFs (+$0.6 billion). The Sector Equity Funds macro-group (-1.80% [quarter] and -2.82% [June]) housed four of the five top-performing classifications in the equity universe for the quarter, but couldn’t keep itself out of the red, being once again relegated to the fourth-place spot of Lipper’s four macro-classifications. The macro-classification was dragged down by its also housing the four worst performing classifications in the universe. At the top of the list for the first quarter in 29 the Commodities Energy Funds classification (one of Q1’s laggards) returned 9.27% for the quarter and 0.40% for June. The classification benefitted from a rise in oil and gasoline prices during the quarter. The next best performing classification- Commodities Agriculture Funds (+5.28% for the quarter) benefitted from June’s rally in grain prices. Despite the on-again, off-again nature of the Greek debt drama, a volatile Chinese market, and a resurgence of news surrounding the possible default by Puerto Rico of its sovereign debt, the World Equity Funds macro-classification (+1.22%) remained at the top of the charts for the second consecutive quarter. Fund investors continued to pad the coffers of developed-market funds in our tally of estimated net flows for the quarter, but they also injected net new money into emerging markets-related funds. Despite its late-month meltdown in June, China Region Funds (+7.64%)-for the second quarter in three-outpaced the other classifications in the group for the quarter, followed by Japanese Funds (+3.95%),International Small-/Mid-Cap Growth Funds (+3.91%), and International Small-/Mid-Cap Core Funds (+3.82%). Japanese Funds got a boost from export-related stocks after the yen showed continued weakness against the greenback. India-related securities suffered from volatility at the beginning of June after the Reserve Bank of India revised its inflation forecast higher, pushing India Region Funds (-3.58%) to the bottom of the macro-classification for the first quarter in eight.