Tag Archives: most-popular

Market Beginners Portfolio – July Update

Summary The Market Beginners Portfolio has had a difficult time over the past few months. The portfolio has significant potential for future growth. I chose to invest in Frontier Communication Corporation because of the future opportunity it provides. Introduction As many of my subscribers know, I have written a large number of portfolios talking for a variety of different goals. However, the original Market Beginners Portfolio represented my first attempt at creating a portfolio designed for someone incorporating multiple different points of view. The overall goal of this portfolio is to create a sample portfolio for someone with $100,000 to invest. The portfolio will be composed of both ETFs and Individual Stocks designed to maximize both safety and income for the portfolio. However, rather than focusing on just income for the portfolio, I will also be focusing on overall stock growth. This portfolio is centered towards overall growth and that involves growth both in the form of income and portfolio value. Rules Discipline is the backbone of any major portfolio. As a result, any good portfolio requires at least a few rules to help keep things in balance. This portfolio has two. The first rule is no new money may be added to the portfolio. While this is not a restriction most people generally face, it is helpful for managing a portfolio and as a result is a rule I include in most of my portfolios. The second rule is that no stock or ETF may make up more than 20% of the portfolio. While having different ETFs or secure stocks may help with the portfolio’s safety, minimizing your positions in different stocks helps to maintain your portfolio’s security. Portfolio Stock Name (Ticker) Number of Shares Purchase Price Current Price Johnson & Johnson (NYSE: JNJ ) 100 $100.55 $100.09 Chevron (NYSE: CVX ) 100 $107.70 $93.14 Pimco Strategic Income Fund (NYSE: RCS ) 1000 $9.19 $8.49 Bank of America (NYSE: BAC ) 1000 $16.47 $18.10 Monsanto Company (NYSE: MON ) 100 $118.25 $107.07 Vanguard Total Stock Market ETF (NYSEARCA: VTI ) 100 $108.73 $109.96 Vanguard Dividend Appreciation ETF (NYSEARCA: VIG ) 200 $81.18 $80.77 Original Portfolio Value: $85,430 Total Cash: $14,570 Current Portfolio Value: $83,770 Current Cash: $14,570 Change In Portfolio Value: -1.94% Portfolio Discussion The portfolio has had a relatively difficult time – it has lost 1.94% over the past few months. Much of this loss is due to a decrease in the prices of Chevron, Pimco Strategic Income Fund, and Monsanto Company. However, the portfolio has done an impressive job in Bank of America seeing that position increase by almost $2000. This helped offset some of the other more significant losses for the portfolio. As for decisions, I am choosing to keep the portfolio relatively simple. However, at this time I am making a 1000 share purchase in Frontier Communications Corporation (NASDAQ: FTR ) at $5.14 per share. That takes the cash position of the portfolio down to $9430. Frontier Communications Corporation is a solid company that has had a difficult time dropping from $8.42 earlier in the year. However, management at the company is solid and the company offers a 8.17% dividend at current prices. Cash I continue to hold a significant cash stake in the portfolio amounting to almost 10% of its assets. Future dividends should help to increase the portfolio’s cash position. The market is currently near all time highs and I am hoping to be able to let the portfolio’s cash position grow until better opportunities can be identified. Conclusion The portfolio has had a difficult time recently losing almost 2% of its value. Despite significant losses in other regions, the portfolio managed to make some of the losses back due to a significant increase in the value of Bank of America. I also chose to invest in Frontier Communications Corporation this month. The company has had a difficult time in recent months and as a result now offers a significant dividend amounting to over 8%. I hope to see this portfolio recover and continue growing in future months. Disclosure: I/we have no positions in any stocks mentioned, and no plans to initiate any positions within the next 72 hours. (More…) I wrote this article myself, and it expresses my own opinions. I am not receiving compensation for it (other than from Seeking Alpha). I have no business relationship with any company whose stock is mentioned in this article.
Best3x4 Variable Asset System With Minimum Volatility Stocks Of The S&P 500

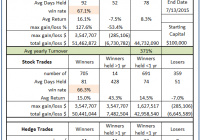
Summary This model can hold 3 to 12 stocks, at variable weightings, selected by a ranking system from a minimum volatility stock universe of the S&P 500. The model has 12 equally weighted slots; a very high ranked stock could occupy a maximum of 4 slots, that is a nominal 33% weighting of the model’s total assets. When adverse stock market conditions exist, the model reduces stock holdings by 35% and invests the proceeds in SDS. The backtest produced a simulated average annual return of about 36% from Jan-2000 to end of June-2015 with a maximum draw-down of minus 22%. The Minimum Volatility Stock Universe of the S&P 500 Minimum volatility stocks should exhibit lower drawdowns than the broader market and show reasonable returns over an extended period of time. It was found that a universe of stocks mainly from the Health Care, Consumer Staples and Utilities sectors satisfied those conditions. This minimum volatility universe of the S&P 500 currently holds 117 large-cap stocks (market cap ranging from $4- to $277-billion), and there were 111 stocks in the universe at the inception of the model, in Jan-2000. Trading Rules The ranking system employed is the same as for our Best8(S&P500 Min-Volatility) system, but the trading system differs in regard to the hedge used and some additional sell rules. The model assumes that stocks are bought and sold at the next day’s average of the Low and High price after a signal is generated. Variable slippage of about 0.12% of a trade amount was taken into account to provide for brokerage fees and transaction slippage. Buy Rules: Some of the largest market cap stocks are exclude from being selected. Sell Rules: Rank Keep the weight of a position in a slot to +10% and -15% of the nominal weight. Realized Trades Analysis An analysis of all the realized trades is shown in Table 1. There were 749 winning trades out of 1116, resulting in a win rate of 67.1%. The average yearly turnover was about 370%. On average a position was held for 78 days. Holdings The models can potentially hold a maximum of 12 different stocks, and a minimum of 3 different stocks. As of July 15 it held 8 different stocks with various weights as shown in Table 2. Performance In the figures below, the red graph represents the model and the blue graph shows the performance of benchmark SPY. The backtest period was 15.5 years, from January 2000 to June 2015. Figures 1 to 5 show performance comparisons: Figure 1: Performance 2000-2015 with market-timing and hedging with long SDS. The model uses a hedge ratio of 35% of current holdings during down-market conditions. (Note: The inception date of SDS was Jul-2006. Prior to this date values are “synthetic”, derived from the S&P 500.) Annualized Return= 36.1%, Max Drawdown= -21.8%. Figure 2: Performance 2000-2015 without hedging. Annualized Return= 34.2%, Max Drawdown= -22.9%. Figure 3: Performance 2000-2015 without hedging and market timing. Annualized Return= 27.8%, Max Drawdown= -49.8%. Figure 4: Performance Jan-2000 to Jun-2015 . Annualized Return= 39.7%, Max Drawdown= -21.5%. Figure 5: Performance Jul-2014 to Jun-2015. Total Return= 58.8%, Max Drawdown= -7.3%. This can be directly compared with our Best12(NYSEARCA: USMV )-Trader model’s return of 28.6% for the same time period. (click to enlarge) (click to enlarge) (click to enlarge) (click to enlarge) (click to enlarge) (click to enlarge) (click to enlarge) (click to enlarge) (click to enlarge) (click to enlarge) Figures 6 to 10 show performance details from Jan-2000 to Dec-2014 for the model with hedging and market timing: Figure 6: Performance versus SPY. Over the 15-year period $100 invested at inception would have grown to $9,170, which is 50-times what the same investment in SPY would have produced. Figure 7: 1-year returns. Except for 2006 the 1-year returns were always higher than for SPY. Figure 8: 1-year rolling returns. The minimum 1-year rolling return of the 3-day moving average was -5.8% early in 2007. Figure 9: Distribution of monthly returns relative to SPY. Figure 10: Risk measurements for 15.5-years and trailing 3-year periods. (click to enlarge) (click to enlarge) (click to enlarge) (click to enlarge) (click to enlarge) (click to enlarge) (click to enlarge) (click to enlarge) Following the Model This model can be followed, exclusively, live at iMarketSignals where it will be updated weekly together with our other trading models. It will not be available as a subscription model at Portfolio 123. Disclaimer One should be aware that all results shown are from a simulation and not from actual trading. They are presented for informational and educational purposes only and shall not be construed as advice to invest in any assets. Out-of-sample performance may be much different. Backtesting results should be interpreted in light of differences between simulated performance and actual trading, and an understanding that past performance is no guarantee of future results. All investors should make investment choices based upon their own analysis of the asset, its expected returns and risks, or consult a financial adviser. The designer of this model is not a registered investment adviser.

LS Opportunity Fund Changes Sub-Advisor, Objective, Strategy

By DailyAlts Staff There have been a number of changes to the LS Opportunity Fund (MUTF: LSOFX ) over the past several months. On April 23, the fund’s Board of Trustees filed paperwork with the SEC announcing the termination of the fund’s sub-advisory relationship with Independence Capital Asset Partners. According to sources, this change was due to the retirement of Jim Hillary, a portfolio manager on the fund and Chairman, CEO and CIO of Independence Capital Asset Partners. In addition to Mr. Hillary’s retirement, the firm will be returning capital to his hedge fund investors. Following the termination of Independence, the fund appointed Prospector Partners, LLC, a Connecticut based asset manager, as an interim sub-advisor and transitioned the portfolio to Prospector on May 28. Shareholders are being asked to approve Prospector as the sub-advisor, along with additional changes to the fund as outlined below, at the upcoming shareholder’s meeting on September 17. Changes to Fund Objectives and Implementation Now the LS Opportunity Fund is planning changes to its investment objective and strategy, as well as giving its advisor more power to hire and fire sub-advisors. According to a July 15 SEC filing, these changes will not result in higher fees for investors, nor will they alter the long/short equity orientation of the fund’s strategy. There is, however, a moderate change to the implementation of that strategy, which will now allow the fund to combine long positions with shorts of two or more stocks in the same sector, whereas previously, it called for “pair trades” of one long and exactly two shorts. The fund’s investment objective has also been slightly revised, with the new objective “to seek to generate long-term capital appreciation by investing in both long and short positions within a portfolio consisting of primarily publicly-traded common stock, with less net exposure than that of the stock market in general.” Formerly, the word “risk” appeared in place of “net exposure” in the fund’s stated objective. Fund Performance The LS Opportunity Fund, which launched in September 2010, has a three-star rating from Morningstar. For the three-year period ending June 30, the fund returned 7.76%, ranking it in the top 38% of funds in its Morningstar category. More recently, however, the fund’s returns haven’t been as strong: Year-to-date, through June 30, the LS Opportunity Fund’s -3.57% returns ranked in the bottom 13% of long/short equity funds. For more information, view a copy of the fund’s prospectus .