Tag Archives: most-popular

The Low Volatility Anomaly And The Delegated Agency Model

Summary This series offers an expansive look at the Low Volatility Anomaly, or why lower risk stocks have historically produced stronger risk-adjusted returns than higher risk stocks or the broader market. This article hypothesizes that the combination of a cognitive bias and an issue around market structure could contribute to the Low Volatility Anomaly. This article covers a deviation between model and market that may contribute to the outperformance of low volatility strategies. In the last article in this series , I demonstrated that the aversion of certain classes of investors to employing leverage flattens the expected risk-return relationship as leverage-constrained investors bid up the price of risky assets. In addition to the inability to access leverage for long-only investors, the typical model of benchmarking an institutional investor to a fixed benchmark (i.e. the S&P 500 represented through SPY ) could also potentially produce a friction to exploiting the mispricing of low volatility assets (represented through SPLV ). If a security with a beta of 0.75 produces the same tracking error as a security with a beta of 1.25, investors may be more willing to invest in the higher beta security with the belief that it is more likely to generate higher expected returns per unit of tracking error. In this framework, if the investor believes that the higher beta security is going to deliver 2% of alpha and that the higher and lower beta assets are going to have the same tracking error relative to the index, then the investor would not purchase the lower beta asset unless it was expected to earn alpha of more than 2%. An undervalued low beta stock with a positive expected alpha, but an alpha below the expected alpha of a higher beta stock with an equivalent expected tracking error, would be a candidate to be underweight in this framework despite offering both higher expected return and lower expected risk than the broad market. This investor preference results in upward price pressure on higher beta securities and downward price pressure on lower-beta securities that could be a factor in the lower realized risk-adjusted returns of higher beta cohorts depicted in the introductory article in this series . In a foreshadowing of the next article on the potential influence that cognitive biases have on shaping the relationship between risk and return, the difference between absolute wealth and relative wealth could be an important distinction that influences the behavior of delegated investment managers. Richard Easterlin (1974) found that self-reported happiness of individuals varied with income at a point in time, but that average well-being tended to be very stable over long time intervals despite per capita income growth. The author argued that these patterns were consistent with well-being depending more closely on relative income than absolute income. This preference for relative outperformance rather than absolute outperformance may signal why some managers think of risk in terms of tracking error rather than absolute volatility. In perhaps a more salient example, Robert Frank (2011) illustrated the relative utility effect through an experiment that showed that the majority of people would rather earn $100,000 when peers were earning $90,000 than earn $110,000 when peers were earning $200,000. Among the assumptions underpinning CAPM is that investors maximize their personal expected utility, but these studies suggest that investors in effect seek to maximize relative and not absolute wealth. Similar to leverage aversion detailed in the last article, the preference for relative utility could be another CAPM violation that contributes to the Low Volatility Anomaly. Gauging performance versus a benchmark is a form of maximizing relative utility, and has become an institutionalized part of the investment management industry perhaps to the detriment of the desire to capture the available alpha in our low beta asset example. I am not trying to minimize tracking error in my personal account, I am trying to generate risk-adjusted returns to grow wealth over time. As I have demonstrated in this series, academic research has shown that low volatility stocks have outperformed on a risk-adjusted basis since the 1930s. Disclaimer My articles may contain statements and projections that are forward-looking in nature, and therefore inherently subject to numerous risks, uncertainties and assumptions. While my articles focus on generating long-term risk-adjusted returns, investment decisions necessarily involve the risk of loss of principal. Individual investor circumstances vary significantly, and information gleaned from my articles should be applied to your own unique investment situation, objectives, risk tolerance, and investment horizon. Disclosure: I am/we are long SPLV, SPY. (More…) I wrote this article myself, and it expresses my own opinions. I am not receiving compensation for it (other than from Seeking Alpha). I have no business relationship with any company whose stock is mentioned in this article.
ETFs To Play 3 Undervalued Sectors

Though a mountain of woes punctured the U.S. market momentum in the first half of 2015 with the S&P 500 barely adding gains thanks to global growth worries, rising rate concerns and specifically the strength of the dollar, the second half looks to be shaping up in a great way. Greece worries have tailed off as the nation somehow managed to strike a debt deal with its international lenders, in turn soothing the nerves of global investors. Back home, the all-important Q2 earnings season got off to a strong start with Finance sector – the backbone of any economy – living up to expectations. All these once again fueled up the market with the Nasdaq registering consecutive record highs in mid-July and the S&P 500 trading at just 0.3% discount to its all-time high hit in May due to the massive rally we’ve seen since for the last six years. So, one might wonder if any value sector is left at all. A value play is especially required given the disappointing earnings string from a few tech bellwethers that has made investors jittery. No doubt, with all the major indices trading at around all-time highs, it is hard to find value plays at home. But for those investors fervently looking for undervalued sectors, there are still a few hidden treasures out there. While several indicators are used to examine any stock or sector’s valuation status, price-to-earnings ratio or P/E has been the most widespread. We have identified three sector picks having the lowest forward P/E ratio for this year’s earnings in the pack of 16 S&P sectors classified by Zacks and detail the related ETFs to play those sectors’ undervalued status. Auto – First Trust Nasdaq Global Auto ETF (NASDAQ: CARZ ) The U.S. automotive industry is accelerating with rising income, persistently lower energy prices, a low interest rate environment, and growing consumer confidence. All these drove auto sales 4.4% higher to 8.52 million units in the first half of 2015, signifying the best six months in a decade. And if this was not enough, auto sales are likely to hit 17 million in full-year 2015, a level never touched in the last 15 years. Despite strong fundamentals, the sector has a P/E ratio of 10.8 times for 2015 and 9.3 times for 2016, the lowest in the S&P universe, as per the Zacks Earnings Trend issued on July 16. Investors should note that the P/E of auto industry trades at 41.3% discount to the current year P/E of S&P and 43.6% discount to the next year P/E. The space is down 4.5% so far this year which says that it is time to turn its loss into your gains. Investors should note that there is only a pure play CARZ in the space that provides global exposure to nearly 40 auto stocks by tracking the Nasdaq OMX Global Auto Index. CARZ has a Zacks ETF Rank #2 (Buy) and is up 1.2% so far this year (as of July 20, 2015). Finance – Vanguard Financials ETF (NYSEARCA: VFH ) The financial sector has set an upbeat tone this earnings season. Several factors including fewer litigation charges, effective cost control measures, loan growth and investment banking activities have given Q2 earnings a boost and made up for still-the low interest rate environment which has long been bothering the sector’s revenue backdrop. Investors should also note that the Fed is preparing for an interest rate lift-off which will pave the way for financial stocks and the related ETFs going forward. The space has a current-year P/E of 14.3 times, a 22.3% discount to the S&P while its next year P/E stands at 13.1 times, a 20.6% discount to the S&P 500’s 2016 P/E. The space has added 2.2% so far this year (as of July 20, 2015). While there are plenty of financial ETFs, investors can take a look at Zacks #1 (Strong Buy) ETF VFH. This $3.48-billion ETF holds a broad basket of over 550 stocks in its portfolio. The fund is up 3.7% so far this year. Transportation – iShares Dow Jones Transportation Average Fund (NYSEARCA: IYT ) This one could be a risky bet as the sector is out of favor right now, having retreated big time from the year-to-date frame (down over 12%). A strong dollar is taking a toll on the profits of big transporters, but other drivers including stepped-up economic activities and cheap fuel are still alive and kicking. This raises optimism on the transportation sector going forward. Actually, transportation stocks gave a havoc performance last year having advanced over 25%. Thus, probably overvaluation was the concern which pushed the space in the bear territory. The current and the next year P/Es for the sector are 13.2 and 12.6 times, a 28.3% and 23.6% discount to the S&P 500, respectively. One way to play this trend is with iShares Dow Jones Transportation Average Fund, which tracks the Dow Jones Transportation Average Index and holds 20 stocks in its basket. The fund has a Zacks ETF Rank #3 (Hold) with a High risk outlook. Original Post

Why Optimal Portfolios Are So Difficult To Create

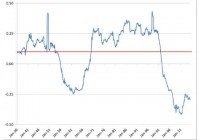
Harry Markowitz won a Nobel Prize in Economics in 1990 for his work on a theory of portfolio management for individual wealth holders. Since that time, Modern Portfolio Theory (MPT) has become the bedrock for creating best-practice portfolio selection methods. Creating an optimal portfolio consists of estimating a portfolio’s future risk and expected return as accurately as possible, based on a variety of inputs. It’s that “as accurately as possible” qualifier that makes the exercise a substantial challenge. MPT requires an investor (or his or her portfolio manager) to: Input expected asset class returns. Estimate the covariances between asset classes, or equivalently, the standard deviations and estimated correlations among asset classes. Decide on portfolio constraints, meaning the limits on the amount going into each asset class. Investors can then compare potential optimal asset allocations for the level of risk they are seeking for their overall portfolio. While there is extensive literature on MPT, accurately projecting an optimal portfolio forward strikes me as nearly impossible. The problem is the estimates. What goes into forecasting an optimal asset allocation has a big impact on what comes out. This often results in suggested optimal allocations that are quite inaccurate, and may lead to portfolio decisions that are counter-productive. Most MPT analysis relies on historical return, risk, covariance and correlation, at least as a starting point. We know that past data can be period-sensitive, so these estimates are often adjusted based on subjective input factors. Investors may have broad views of future Federal Reserve interest rate policy or of the future equity risk premium (ERP). This range of opinion can add wide variability to the accuracy of the outcome. Using only historical data for covariance and correlation can lead to large errors in portfolio optimization. For example, the long-term average correlation between US stocks and 5-year Treasury bonds from 1926-2014 has been +0.1 (correlation ranges from +1.0 to -1.0). However, an analysis of rolling correlation shows this average is far from stable. The 10-year correlation passes through +0.1 on rare occasions, but isn’t there for long. Figure 1 highlights the long-term average correlation (red line) between US stock and 5-year Treasury bond returns using monthly data from January 1936 through September 2014, and the rolling 10-year correlations (blue line) over the same period. Correlation is dynamic, not stable. When you measure correlation and how you measure it has a large bearing on the optimization output. Figure 1: Rolling 10-year Correlation of US stocks and 5-year T-bonds (click to enlarge) Source: CRSP Total US market and Treasury data from Dimensional Fund Advisors, figure by Rick Ferri Markowitz acknowledges the problem of using inaccurate correlation estimates for portfolio optimization in a recent paper he co-authored: ” Enhancing Multi-Asset Portfolio Construction Under Modern Portfolio Theory with a Robust Co-Movement Measure ” by Sander Gerber, Markowitz and Punit Pujara. The authors then attempt to address the issue with a more complex approach to estimating this variable. While the analysis is beyond the scope of this article, it’s fair to say that accurately estimating future correlation is a difficult problem for investors who are trying to solve the optimization puzzle. There are other ways to estimate portfolio risk and return that circumvent correlation estimates. One way is to assume there is no efficient frontier . Each asset class used in a portfolio has its own expected risk and return, and a portfolio of asset classes has an expected risk and return based on the weighted average risk and return of each asset class used in the portfolio. There is no assumed benefit from MPT. The weighted average method to estimating a portfolio’s overall risk and return may be a throwback in time, but it is conservative and does eliminate errors from inaccurate asset class covariance or correlation forecasts. You can read more about this method in my book All About Asset Allocation . Portfolio optimization sounds elegant in theory, but using it in practice is another matter. To have a useful outcome, MPT methodology requires an investor to input accurate asset class expected returns, standard deviation, and covariance or correlation among asset classes. That’s a tall order. Perhaps additional research such as the paper mentioned herein will help, but I’m not betting my retirement savings on it. Disclosure: Author’s positions can be viewed here .