Tag Archives: most-popular

Global And Short-Term Treasury: 2 ETFs To Watch On Outsized Volume

In the last trading session, the U.S. stocks ended their five-day losing stretch on strong earnings reports and stabilization in the Chinese market. Among the top ETFs, investors saw the SPDR S&P 500 Trust ETF (NYSEARCA: SPY ) gain 1.2%, the SPDR Dow Jones Industrial Average ETF (NYSEARCA: DIA ) move higher by 1.1% and the PowerShares QQQ Trust ETF (NASDAQ: QQQ ) gain 0.9% on the day. Two more specialized ETFs are worth noting as both saw trading volume that was far outside of normal. In fact, both these funds experienced volume levels that were more than double their average for the most recent trading session. This could make these ETFs ones to watch out for in the days ahead to see if this trend of extra-interest continues: iShares MSCI ACWI (All Country World Index) Index ETF (NASDAQ: ACWI ) : Volume 4.9 times average This global ETF was in focus yesterday as about 5.6 million shares moved hands compared to an average of roughly 1.2 million shares. We also saw some price movement as ACWI gained 1.2% in the past session. The movement can largely be blamed on lower oil prices, uncertain economic growth worldwide, and a possible interest rate hike, which can have a huge impact on global stocks like the ones we find in this ETF portfolio. For the past one-month period, ACWI was down nearly 2.2%. The fund currently has a Zacks ETF Rank #3 (Hold). S chwab Short-Term U.S. Treasury ETF (NYSEARCA: SCHO ) : Volume 4.0 times average This short-term treasury ETF was under the microscope yesterday as more than 693,000 shares moved hands. This compares to an average trading day of around 181,000 shares and came as SCHO lost 0.4% in the session. The big move was largely the result of the uncertainty over the Fed’s interest rate outlook ahead of its meeting. SCHO added 0.2% in the past month and currently has a Zacks ETF Rank #3. Link to the original article on Zacks.com Share this article with a colleague

Risk? What Risk?

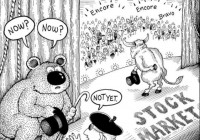
By Dominique Dassault Equity Risk Is Increasingly Non-Existent… By The Numbers The concept of risk for hedge fund managers is a constant concern. The internal monologue goes something like this…”what’s my downside if I initiate this position… how much can I lose if I am not right?” The real answer is that you really have no idea… despite best efforts… even with stop losses [which I abhor]. The true, measurable risk of any position is only exactly known after you liquidate the position. Plus, risk management is more capital management than single stock management. Little did he know how it would all end… Cartoon via wallstreetsurvivor.com How much capital are you assigning to each position in the context of the entire portfolio capital? And are your different positions correlated or not? Even if they are [not], historically, there is no guarantee that correlation [or not] will continue. Anyway… back to risk. Every day my prime broker blasts me with a report loaded with scores of trading metrics calculated over many time frames [mostly the last twelve months]. It is all very interesting but the only real metrics I care to focus on are total returns and risk-adjusted returns. Most clients could not care less about risk-adjusted returns… but I sure do. And, as many are aware, the holy grail of risk metrics is the Sharpe Ratio [as calculated according to the title of this post]. The most interesting precept of the Sharpe Ratio, in my opinion, is that it treats volatility as random… both upside and downside volatility. No way to predict it in either direction so both directions are assigned the same discounting value. Basically, according to Bill Sharpe, all volatility is a penalty against your performance. I get it. Still, in a perfect world, what if most of the volatility experienced by a portfolio of equities was actually favorable? So rare… if not impossible… but still at least worthy of consideration. And so the Sortino Ratio [or as I refer to it as the Gain/Pain Ratio] was born… essentially, it is exactly as the Sharpe Ratio but stratifies favored and unfavored volatility. Favorable volatility is not penalized. Unfavorable volatility is scored as a legitimate demerit. It has always seemed fairer to me. (click to enlarge) The difference between the Sharpe and Sortino ratios Naturally, both ratios are relevant and higher values for both measurements reflect better risk-adjusted returns. And portfolio managers realize that, no matter the ratio, both need to be positive…or you are losing money. However, given full investment of capital, the Sharpe Ratio can be strongly positive yet still not offer high absolute returns. Conversely, if your Sortino Ratio is high, you are probably delivering very strong absolute returns… again, assuming full investment of capital. An Era of Painless Gains Given all of this… What is a good numerical value for both ratios? Generally, over time, any value > 1.5 is pretty good and numbers > 2.0 are stellar. Be advised the data may vacillate, a little bit, based on the time frame used in your calculation i.e. weekly or monthly. Recently, I constructed a model that required one, three and five-year Sharpe Ratios for the S&P 500. I also decided to include the Sortino Ratio. Prior to the results, I hypothesized that the numbers ought to be pretty impressive given the endless equity “bull” since March 2009, but I was still curious to get the exact data. Plus, a weekly price chart of the S&P 500, since 2009, visually reflects the anomaly of very limited drawdowns in the context of extremely strong returns. The calculations are as follows and as Mrs. Doubtfire once said…”Effie… Brace Yourself.” Sharpe Ratio 1-Year = 1.37 3-Year = 1.86 5-Year =1.0 Sortino Ratio 1-Year = 2.65 3-Year = 3.41 5-Year = 1.69 Collectively, these numbers are clearly impressive but even more so in that they are calculated from a passive, long only strategy. This is a hedge fund manager’s worst nightmare as, for five years, most “hedging” has proved to be only performance degrading. (click to enlarge) S&P 500 index – since the 2009 low, hedging has essentially just been a performance drag, with the possible exception of the 2011 correction. Furthermore, the Sortino Ratio data are nothing short of staggering. What they really say = Plenty of Gain with Very Little Pain … and it really is unsustainable if only because it has become much too easy to generate positive returns with very little effort, pain or savvy. To the Ignorant the Spoils It actually seems, at times, as though there is this mysteriously large buyer that suddenly appears whenever the equity market most “needs it”… and the subsequent buying is so aggressive and so desperate… not the style of the mostly steady “hands” I personally know. It just seems too good to be true and the Sortino Ratio numerically reflects that belief. Plus, we all know that the economic fundamentals are not as smooth as the weekly or monthly charts of the S&P 500 would suggest. Remember that equities typically offer the most risk of any asset class… not the lowest risk as the above data set suggests. Nevertheless, Yellen and Bernanke must be “psyched” as their “wealth effect” model has been so effective… actually too effective as the market distortions grow ever larger… and more market bears become contorted “road-kill.” To be sure these distorting effects may be entirely assigned to The Fed… the debt monetizing, interest rate suppressing “Masters of the Universe” who always get what they want while answering to nobody. They’ve literally trounced and expectorated on the concept of “moral hazard” and, it seems, purposely reconfigured and redefined its meaning into: We have no economic morals and this poses an enormous hazard to the performance of hedged money managers. The spoils go to the ignorant only – the Fed’s true heroes. Charts by: Advisor Central, BigCharts

SCHZ: A Remarkably Complete Bond Fund

Summary I’ve been looking for some medium to high quality fixed income investments. My preferred method of making the investments is buying ETFs. I want something with decent yields, excellent internal diversification, and reasonable or better levels of liquidity. I would accept some credit risk or some duration risk to increase yields, but expense ratios have to be low. SCHZ offers investors an incredibly diversified portfolio of fixed income investments and I may use it from time to time. Since the Schwab U.S. Aggregate Bond ETF (NYSEARCA: SCHZ ) is a Schwab ETF it is eligible for free trading in Schwab accounts. Since I want to be able to use my bond ETF as a place to park cash and earn some yield off of it, I want that free trading to move money in and out. With an expense ratio of only .05% (not a typo), I’m very impressed with this ETF. To be fair, the largest factor in my decision to open accounts with Schwab was the free trading on low fee ETFs. It shouldn’t be surprising that I like several of their funds since I picked them as a brokerage after I glanced at their ETF offerings. The Good The portfolio offers an absolutely remarkable diversification of fixed income investments. Investors are getting exposure to treasury securities, mortgage pass-thru securities, and corporate bonds. There are even small allocations to non-us corporate debt, municipal bonds, and other small sections of the market. For a fixed income investor looking for one stop shopping for a bond ETF, this is probably one of the best options on the market. The average volume is running around 170,000 shares per day which is enough liquidity to avoid any major concerns. The average yield to maturity is running 2.46%. Given the low interest rate environment we are facing at a macroeconomic level, this is pretty reasonable. All fixed income investors would love to see higher yields on their investments, but 2.46% is solid compared to any similar alternatives. The effective maturity is over 7.3 years and the effective duration just over 5.3 years. That level of duration risk is fairly reasonable for matching my risk tolerance. If yields were higher on a macroeconomic level, I would be willing to tolerate more duration risk. The Bad While the portfolio is a strong contender for one stop shopping, as an mREIT analyst I can’t stomach paying NAV for an investment containing MBS. I can acquire my MBS exposure at a substantial discount to NAV, though I must admit that when buying mREITs I am effectively paying a much higher expense ratio. Regardless, when mREITs trade at huge discounts to NAV, I don’t want my portfolio to include any exposure to MBS where I am paying NAV. I expect that within the next few years we will see fair values for MBS take a meaningful hit. I want that expectation priced into my investment. Overall, holding MBS is not a bad thing. If mREITs were trading at a premium to book value, I would happily be buying into an ETF that trades around NAV and holds the same securities. When mREIT share prices and book values align, I’ll be tempted to make SCHZ a portion of my investment portfolio. It is a solid ETF that is hampered only by the fact that investors have the opportunity to buy MBS exposure at a discount to NAV. The category for “Mortgage Pass-Thru” is currently weighted at 28.9% of the portfolio. This comes in second for weightings with U.S. Treasuries over 36%. The third category is U.S. Corporate with a weight just over 21%. Interesting Notes I tend to be a buy and hold investor with the exception of being willing to do some trading in microcap securities when I think a lack of coverage is allowing prices to deviate from intrinsic value. When it comes to a bond ETF, I want to be able to rapidly move money in and out and of the investment so it functions as a cash fund. I find it interesting that the portfolio turnover is 74% for the Schwab U.S. Aggregate Bond ETF. Frequently I see high portfolio turnovers with excessively high expense ratios, but here the expense ratio is incredibly low. I don’t mind the portfolio turnover since there is no high expense ratio. My problem is not an issue with frequent trading in an ETF; I simply don’t want to pay for it. If it is free, that is fine with me. Conclusion The Schwab U.S. Aggregate Bond ETF is an exceptional bond fund with a low expense ratio and great internal diversification. The only thing that keeps from selecting it as a fixed income investment is that I’m trying to avoid buying MBS at NAV when I cover mREITs and feel confident that I can select solid mREIT investment options on my own. I want to use the diversified low fee ETFs for everything else. When mREITs see share prices and NAVs align, SCHZ will be a very strong contender for use as a fixed income investment or for parking cash while I wait for other opportunities in equity investing. I feel the market is a little frothy and I’m looking to shift my portfolio to have slightly less risk to a downturn in the equity markets while still making enough money off yields to offset inflation. This ETF does both of those things, so the exposure to MBS is the only reason I’m not using it right now. Disclosure: I/we have no positions in any stocks mentioned, but may initiate a long position in SCHZ over the next 72 hours. (More…) I wrote this article myself, and it expresses my own opinions. I am not receiving compensation for it (other than from Seeking Alpha). I have no business relationship with any company whose stock is mentioned in this article. Additional disclosure: Information in this article represents the opinion of the analyst. All statements are represented as opinions, rather than facts, and should not be construed as advice to buy or sell a security. Ratings of “outperform” and “underperform” reflect the analyst’s estimation of a divergence between the market value for a security and the price that would be appropriate given the potential for risks and returns relative to other securities. The analyst does not know your particular objectives for returns or constraints upon investing. All investors are encouraged to do their own research before making any investment decision. Information is regularly obtained from Yahoo Finance, Google Finance, and SEC Database. If Yahoo, Google, or the SEC database contained faulty or old information it could be incorporated into my analysis.