Tag Archives: most-popular

Southern Company: A Stock For Income Investors

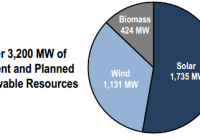
SO has been undertaking correct strategic initiatives by incurring capital spending to develop and strengthen power generation fleet. Company can opt to accelerate its capital spending targeted at renewable power sources. Southern expects to grow its long-term earnings in a range of 3%-4%. Dividend offered by SO stays secure, and the stock is a good investment prospect for income-hunting investors. Utility companies have remained a popular investment choice for income-seeking investors, as utilities offer attractive and solid dividends. In recent times, utility companies have accelerated their capital spending to expand and strengthen regulated operations. Also, utility companies have been scaling down unregulated operations, which will provide stability to their revenue and earnings. Southern Company (NYSE: SO ), which has a solid regulated asset base, stays an impressive investment prospect for long-term income investors, as it offers a solid yield of 5.1% . The company has been undertaking various construction projects and incurring capital investment to strengthen its regulated asset base, which will fuel its rate base and earnings growth in future. However, delays and cost overruns associated with the ongoing construction projects have inflated the company’s risk profile and will limit the upside to the stock price in the near term. The stock is trading at a slight discount to its peers on the basis of forward P/E, which I think is justified given risk delays and cost overruns. Financial Highlights and Stock Price Catalysts The company’s financial performance is backed by its regulated assets base; the company generates more than 90% of its earnings from regulated operations. Southern Company posted a strong performance for 2Q2015; EPS for the quarter came out to be $0.71 , ahead of consensus of $0.69 and the 2Q2014 EPS of $0.68. The performance for the second quarter was supported by rate increases, the strong performance of its subsidiary Southern Power and favorable weather conditions; total weather normalized sales increased by 1%. Also, the company enjoyed weather normalized growth for the second consecutive quarter in all of its three customer segments, including commercial, residential and industrial segments. The company maintained its 2015 EPS guidance range of $2.76-$2.88; however, I think given its strong first half performance, Southern will increase its EPS guidance range for 2015 in October during the 3Q2015 earnings call. The company has been making capital investments to strengthen its power generating fleet; the company plans to make capital spending of more than $16 billion from 2015 through 2017, which will allow its long-term earnings to grow in a range of 3%-4% . In addition, the company has been aggressively working to grow its renewable generation portfolio, and plans to have a renewable generation capacity of almost 3,200MW, including solar, wind and biomass. The company will continue to direct capital spending toward the expanding renewable energy portfolio to take advantage of the 30% solar investment tax credit before the end of 2016. Moreover, given the attractive regulatory environment for renewable capital spending, the company can opt to increase its capital spending for future years, which will positively affect its future earnings growth and the stock price. The following graph reflects the current and planned renewable resources for Southern. Source: Investors Presentation Despite the company’s strong regulated asset base, the ongoing construction of nuclear and coal gasification (IGCC) projects stay a concern for investors. The company’s nuclear project ‘Vogtle’ is on track, and unit 3 and unit 4 are expected to be in operation in 2Q2019 and 2Q2020, respectively; however, substantial construction work remains, and cost overruns and delays will weigh on the stock price. On the other side, the company registered another charge of $14 million for the Kemper project; the project is expected to be completed by 1Q2016. However, delays beyond 1Q2016 are expected to increase the project cost by $20-$30 million every month. Cost overruns and construction delays associated with the ongoing two construction projects have inflated Southern’s risk profile and will limit stock price appreciation in the near term, and the stock return will be dividend driven. The stock trades at a slight discount to peers, which I think is justified given the construction risk attached to the company; Southern is trading at a forward P/E of 15.20x , versus the utility sector’s forward P/E of 16.5x . In my opinion, the stock valuation will not expand and the stock will not trade in-line with its industry P/E multiple until the company’s construction project-related risk decrease or/and its EPS growth accelerates. Separately, the company’s management does not have any plans to issue equity until 2017 to finance its planned capital investments; however, if the company experiences delays and increases in construction costs, the management might revisit their financing assumptions and could consider to issue equity, which will adversely affect its EPS. Summation Southern Company has been undertaking the correct strategic initiatives by incurring capital spending to develop and strengthen its power generation fleet. Going forward, the company can opt to accelerate its capital spending targeted at renewable power sources, which will augur well for its long-term earnings growth; currently, Southern expects to grow its long-term earnings in a range of 3%-4%. Also, dividend offered by the company stays secure, and the stock is a good investment prospect for income-hunting investors, as it offers a yield of 5.1%. However, the construction risk will limit a stock price increase in the near term. Disclosure: I/we have no positions in any stocks mentioned, and no plans to initiate any positions within the next 72 hours. (More…) I wrote this article myself, and it expresses my own opinions. I am not receiving compensation for it (other than from Seeking Alpha). I have no business relationship with any company whose stock is mentioned in this article.
Beware Of Screens

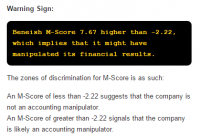
Summary When doing work on IBM recently, we came upon a significant mistake made by one of our data providers. Had we acted on this result without doing due diligence, we would have missed what we consider a profitable trade at best or lost money on puts at worst. Screens represent a general problem: a preponderance of data and a dearth of insight. Use screens as a starting point only. They should be your first tool, not only tool. Investors face a host of risks that they willingly take on. There’s the biggest risk (risk of overpaying), sentiment risk, market obsolescence, risks flowing from the capital structure etc. One of the risks that’s talked about less often is what we call “the input risk”. We know of a few horror stories where people invested based entirely on web based screens and have come to regret it. In this short piece, we want to offer a specific example of why this is such a risk and make a general point about how investors should use these valuable, but limited tools. The advice seems simple, but like a great deal of simple advice, it’s followed infrequently by some. This may be unwelcome news to some people who prefer the magic bullet solution to a systemic problem: doing well at this requires a great deal more work than running a screen. We only publish a portion (sometimes a small portion) of the work we do when analysing a company. There’s actually a great deal going on below the surface here. There are two reasons for keeping most of our work to ourselves. First, we offer it to paying clients. It’s only fair. They paid for it. Second, we believe the wider readership would rather not be subjected to even longer screeds about a given name than we normally impose upon them. For instance, we like to focus on what the sales community (sorry…the ” analyst ” community…) is saying about a particular name, since they often act as a long-run contra indicator. We also like to review the likelihood that a given company is a financial manipulator. We do this in a variety of ways and for obvious reasons. For anyone who’s interested, feel free to on one of the methods we use, developed by professor Messod Beneish . One Example Of How Things Could Have Gone Badly When we started our analysis of IBM (NYSE: IBM ) recently , we started by reviewing a financial website (Gurufocus). Gurufocus is one of our favourite go-to sites and is often very useful, but when it’s mistaken it’s really mistaken. In particular, the site claimed that there was a better than average chance that IBM was a financial manipulator, based on its M-score. When we calculated the score ourselves, we determined that IBM is no more likely to have failed Beneish’s manipulator screen than any other company. Gurufocus responded to our query by saying that it relies on financial results posted by Morningstar, so we should approach that organisation. This is strange because the Morningstar numbers and the Gurufocus numbers don’t agree across the board. In this instance, Gurufocus/Morningstar didn’t include one of the components of IBM’s accounts receivable in March 2014, making it look as though the company’s accounts receivables have ballooned massively over the past four quarters. For the record, when accounts receivables grow massively and rapidly, that’s a huge red flag. The fact is that this didn’t happen at IBM, so that company was unfairly painted with the “manipulator” brush. Source: Gurufocus, July 28, 2015 The actual results are these: Source: Company filings The actual M-Score for IBM is ~-3, which means that it does not fail the screen developed by professor Beneish. If the reader is interested in learning more about the M-Score and professor Beneish’s methodology, feel free to check out some earlier work or have a look at some online resources . If we simply placed a trade based Gurufocus’ findings, we believe we would have injured ourselves and our clients over the coming year. We would have either not bought a company that we’re actually generally bullish on, or we would have lost money on puts. If we didn’t discover the problem with the way accounts receivable was being calculated, we could have come to a faulty conclusion. There’s a lesson about double checking screens here. Conclusion This isn’t to say that such services are not valuable. Sites like Gurufocus and YCharts and others improve productivity tremendously. They help investors search the universe of stocks in seconds. The problem is that if you make investment decisions based on their results alone, you’re taking on unnecessary risk. The proliferation of sites that allow us to aggregate the vast amounts of data available is both a symptom and a cause of the preponderance of data and a (relative) dearth of insight. When starting to invest, we recommend using sites like these as a starting place, and when you find something interesting, immediately go to the actual sources. The fact that so many investors seem frightened of financial statements and their accompanying notes leads us to believe that there’s potential profit to be had if you train yourself accordingly. We’re reminded of how Jim Chanos spotted the Enron debacle first because so few other analysts read the notes to the financial statements published by that company . The SEC website is as available as any other and it should be the place you visit just after hearing about a company through one of the available tools. These screens are great as a first but not final tool. Disclosure: I/we have no positions in any stocks mentioned, and no plans to initiate any positions within the next 72 hours. (More…) I wrote this article myself, and it expresses my own opinions. I am not receiving compensation for it (other than from Seeking Alpha). I have no business relationship with any company whose stock is mentioned in this article.

Concentration Consternation

By Chris Bennett “There are 3 kinds of lies: lies, damned lies, and statistics.”- Mark Twain Earlier this week, The Wall Street Journal pointed out that a mere six stocks (Amazon (AMNZ), Google (NASDAQ: GOOG ), Apple (NASDAQ: AAPL ), Facebook (NASDAQ: FB ), Gilead, and Disney) had accounted for more than 100% of the S&P 500’s year-to-date gains. This degree of concentration (reminding some of the peak of the 1990s’ technology bubble) is said to raise “concerns about the health of the market’s advance.” While the article’s arithmetic was correct, its concerns may be misplaced . We don’t have to look back to the tech bubble to see a similar concentration of index returns: During 2011, 4 stocks (Exxon, Apple, IBM, and Pfizer) accounted for more than 100% of the total return of the S&P 500. This did not “presage a pullback,” however, as the S&P 500 followed with 3 straight years of double-digit gains . What was similar about 2011 and 2015 through July 27 (the date of the Journal ‘s analysis)? Aggregate returns were de minimis . In 2011, the S&P 500 gained 2% on a total return basis (and was flat on a price return basis). The total return of the S&P 500 in 2015 was less than 2% through July 27. In both periods, the return of the index was relatively low, making it easy for a small group of strong stocks to account for more than 100% of total performance. Following a few positive trading days, incidentally, “The Only Six Stocks That Matter” now account for only half of the S&P 500’s year to date total return. As of July 29, it would take 22 stocks to account for 100% of the market’s return. Just as the concentration of performance doesn’t lead to reliable conclusions about the market’s future absolute return, it also tells us little about the relative performance of active managers vs. their passive benchmarks. Active managers tend to underperform both when index returns are heavily concentrated among a few stocks and when returns are more widely distributed. In 2011, when four stocks accounted for 100% of the market’s return, 81% of large cap U.S. funds lagged the S&P 500 . 2014 was quite a different year in terms of returns and individual stock contributions to index returns: the S&P 500 ended the year up 14% and it required 176 stocks to account for the market’s total return. Yet active managers did not prosper in these conditions either, as 86% of large cap funds failed to outperform the S&P 500. While it makes for an exciting headline, concentration is no cause for consternation . Disclosure: © S&P Dow Jones Indices LLC 2015. Indexology® is a trademark of S&P Dow Jones Indices LLC (SPDJI). S&P® is a trademark of Standard & Poor’s Financial Services LLC and Dow Jones® is a trademark of Dow Jones Trademark Holdings LLC, and those marks have been licensed to S&P DJI. This material is reproduced with the prior written consent of S&P DJI. For more information on S&P DJI and to see our full disclaimer, visit www.spdji.com/terms-of-use .